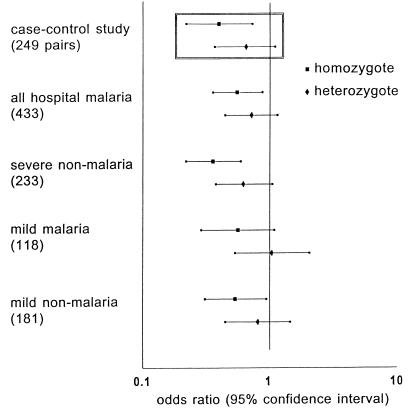
Figure 2.
Risk of clinical disease compared with community controls according to genotype for α+-thalassemia. Odds ratios with 95% confidence intervals represent the risk for children with α+-thalassemia of developing each of the clinical outcomes relative to normals. Numbers in each group are shown in parentheses. (Inset) Results from the matched index case-community control analysis (Table 1).

