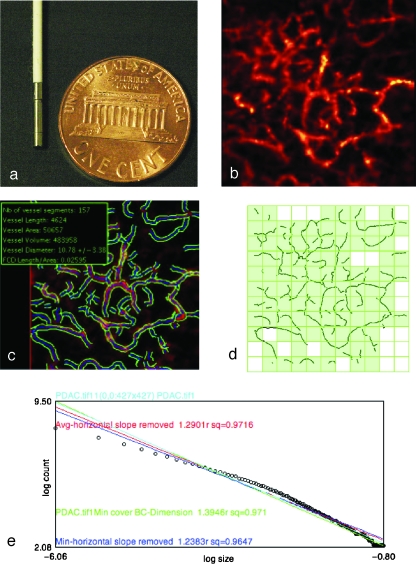
Figure 1.
Vessel segmentation algorithm was applied to raw images to outline the border and midline of detected vasculature networks. On the basis of this process, quantitative morphology and fractal analyses could be applied. (a) The tip of the microprobe is 1.5 mm in diameter, enabling it to explore internal organs with only a small incision. (b) Microvasculature of pancreatic ductal adenocarcinoma. (c) After segmentation algorithm was applied, information on vessel density, diameter, volume fraction, and diameter distribution were obtained. (d) Image from (c) was RGB-filtered to select the blue channel that contained the vessel midline. Thresholding and binarization were applied to the resultant image to give a skeletonized image with only the vasculature outline. Fractal analysis was applied to this outline. Grid counting method was applied to obtain the fractal parameter fractal dimension. Grids of varying sizes were overlaid on the image. The number of grids containing a vessel segment (shown by the light green-filled boxes) at each grid size was plotted against the grid size at logarithmic scales (e). A best-fit regression line was drawn to fit the resultant points (shown here with open circles), and the negative slope of this line denotes fractal dimension, which serves as a measure of the vasculature's complexity. For each image, four such lines would be drawn, each of which represented a different starting point to overlie the grids. The four lines (shown here with different colors) were averaged to give the final fractal dimension for the image.

