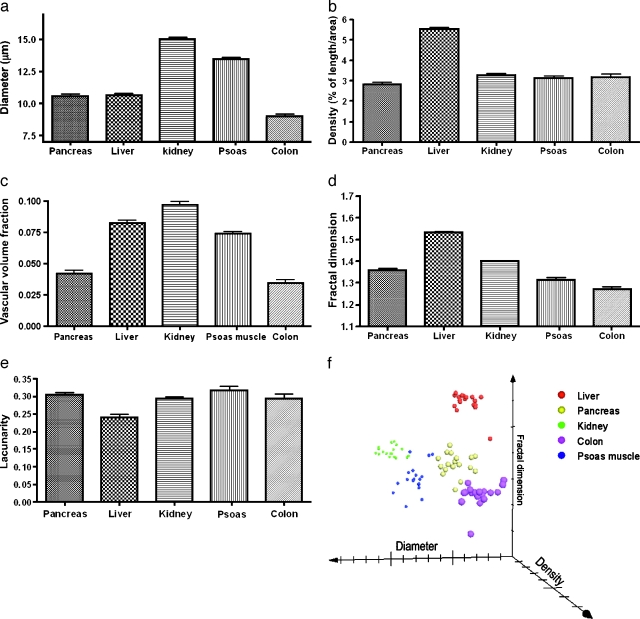
Figure 3.
Quantification of microvasculature morphology of abdominal organs. (a) Vessel diameter. (b) Vessel density was computed as a percentage of vessel length over the image area. (c) Vascular volume fraction was computed from vessel density and diameter. Fractal analysis of fractal dimension (d) and lacunarity (e). (f) Organ-specific clustering in this 3D scatterplot suggested that these different organs' microvasculature has a unique set of diameter, density, and fractal dimension. Each point represented one measurement. Results were obtained from four different animals.

