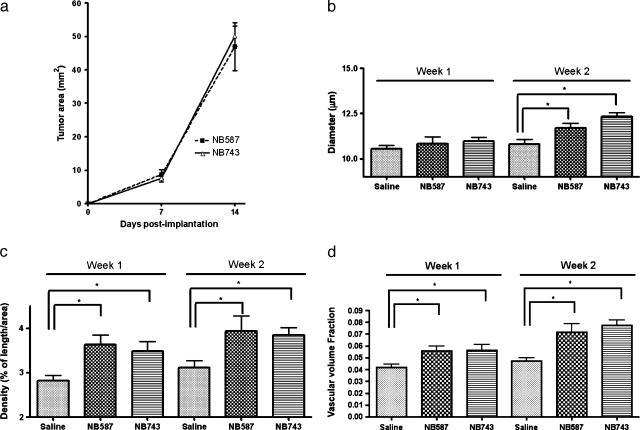
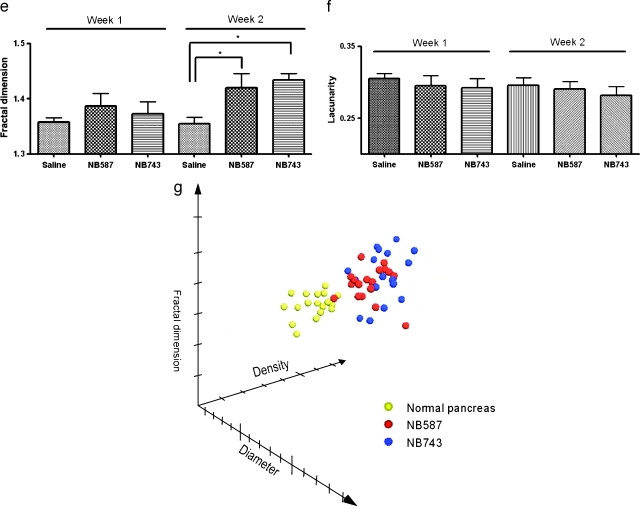
Figure 5.
Characterization of microvasculature of pancreatic ductal adenocarcinoma over time. (a) Tumor area from the same set of mice (7 in each, 21 total) was measured at weeks 1 and 2. (b) Both lines of PDAC tumors did not show a significant change in vessel diameter by week 1. However, by week 2, both had significantly larger-diameter vessels compared to the control. (c) Both lines of PDAC tumors showed significant increase in vessel density by week 1; these differences became more accentuated by week 2. (d) Volume fraction also became significantly greater for the tumors by week 1. (e) Fractal dimension did not change by week 1, but became significantly elevated for both lines of tumor. (f) Lacunarity remained unchanged during the 2-week period. (g) A 3D scatterplot showing an increase in vessel density, diameter, and fractal dimension secondary to orthotopic PDAC, represented by an upward shift in all axes from the control group (dashed arrow). The two tumor lines mixed into one cluster. Each point represented one measurement.


