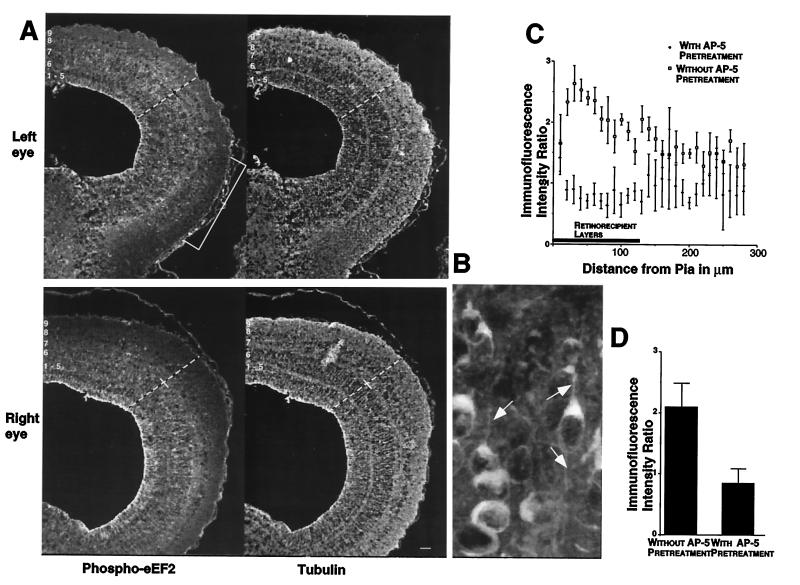
Figure 4.
Patterned visual stimulation causes eEF-2 phosphorylation within retinorecipient layers of the tadpole tectum. (A) Sections from tecta receiving either activated (Upper, left eye) or silenced (Lower, right eye) retinal input were stained for both phospho-eEF2 (Left, FITC) and tubulin (Right, Texas red). The white numbers indicate the location of the tectal layers. The dashed lines show representative line scans used for sampling fluorescence intensity. The small cross-hairs mark the boundary between the retinorecipient layers, 7–9, and the rest of the tectal layers. The white bracket shows the location of the ventral visual field projection that was shaded from the strobe and moving bar stimuli. This area of tectum provides an estimate of phospho-eEF2 levels caused by active but not directly stimulated retinal input. Signals for each fluorophore were imaged simultaneously from a single section. (B) A high magnification of tectal neurons and dendritic segments that are positive for eEF2 phosphorylation resulting from visual stimulation. Note the scattered punctate staining, which represents fine dendritic processes (arrows). (C) Laminar distribution of the ratio of phospho-eEF2 fluorescent signal in stimulated and silenced inputs in the absence (open squares) and presence (solid diamonds) of topically applied 60 μM AP5. The average location of retinorecipient layers is indicated by the bar along the abscissa. Error bars show the standard deviation of the average value from 5-pixel bins. (D) Histogram plots of the average ratio of phospho-eEF2 fluorescent signal between stimulated and silenced retinorecipient layers in the absence and presence of topically applied AP5. Error bars are the standard deviation derived from the average values for each individual used in the analysis (n = 3 with AP5 and n = 5 without AP5). Scale bar for A represents 50 μm.

