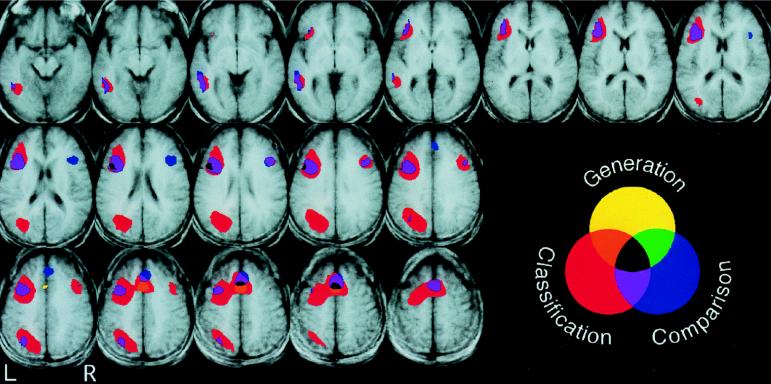
Figure 2.
Axial slices, 3.75 mm thick (z = −11 to z = 53), showing regions of significantly greater signal during the High Selection condition compared with the Low Selection condition in the Generation task (shown in yellow), the Classification task (shown in red), and the Comparison task (shown in blue). Overlap between pairs of tasks is shown in purple, green, and orange, and overlap between all three tasks is shown in black. Shown are voxels that exceeded a threshold of t = 3.67, mapwise α = 0.05 (corrected for multiple comparisons).

