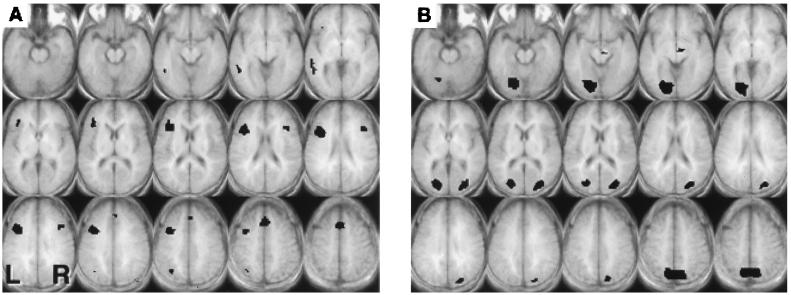
Figure 3.
Axial slices, 5 mm thick (z = −15 to z = 55), showing voxels that exceeded a threshold of t = 3.67, mapwise α = 0.05 (corrected for multiple comparisons) for the Comparison task. (A) Regions of significantly greater signal during the High Selection condition compared with the four-choice Low Selection condition. (B)) Regions of significantly greater signal during the four-choice Low Selection condition compared with the two-choice Low Selection condition.

