Figure 2.
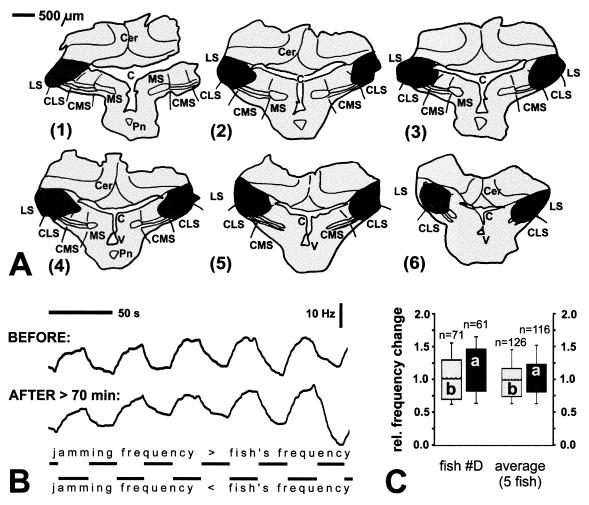
Bilateral lesion in CLS and LS and significance for JAR in Eigenmannia. Same convention as in Fig. 1 A–C applies. (A) Frontal sections through ELL. Sections are about 250 μm apart. (B) Frequency–time courses of EOD for presentation of signals in compartments 2–4. (C) Medians of EOD frequency changes before and after lesion for same case depicted in A and B (left pair of boxes, rank sum test, P = 0.325) and average of five fish (right pair, rank sum test, P = 0.645). Lower and upper end of boxes define 25th and 75th percentile, respectively, with a solid horizontal line at the median and a hatched line at the mean. Error bars indicate the 10th (lower) and 90th (upper) percentiles.

