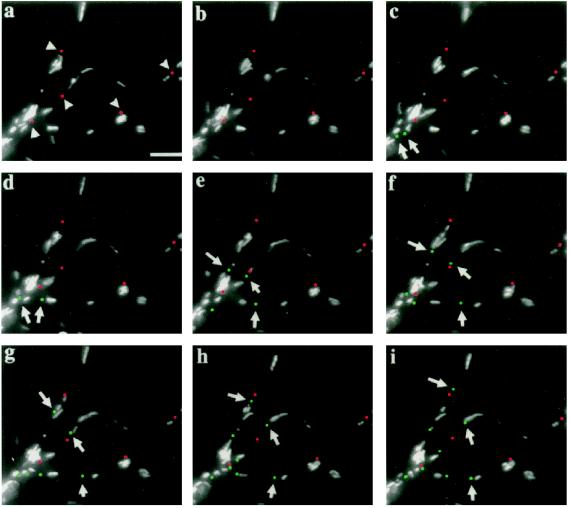
Figure 2.
Time lapse of RNA granule transport in neurites of cultured cortical neurons stimulated by NT-3 (a) SYTO 14-labeled neurites 5 min after NT-3 treatment in which arrowheads point to the baseline locations of those RNA granules present at the initiation of the experiment (colorized in red). The remaining labeled intracellular structures are mitochondria. The end of the proximal neuritic shaft is located at the bottom left hand corner. (b–i) Micrographs show neurites at 1 min intervals from 8 to 15 min after NT-3 treatment. Arrows point to some of those RNA granules that appeared during the interval (colorized in green). (c) New granules first appeared close to the proximal shaft at 9 min and (d–i) are observed to move distally into the neurites (arrows). (Bar = 10 μm.)

