Figure 1.
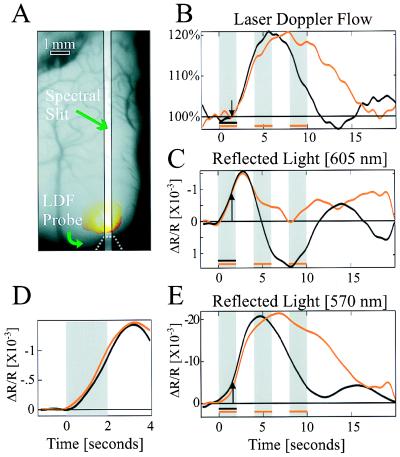
Simultaneous measurement of cortical reflection and CBF. (A) An image of the cortical surface, the location of slit used for imaging spectroscopy, the tip of LDF probe, and the reflection of its beam from the cortex. The yellow spot marks the cortical region that was illuminated by the LDFs laser during the measurements. (B, C, and E) Cortical response to visual stimulation. Black curves represent response to short stimulus (2 sec), and red curves represent its response to long stimulus (10 sec, composed of 2 on, 2 off, 2 on, 2 off, 2 on). Each curve is the average response to 24 stimulation periods during a single experiment. (B) LDF response. Its onset (arrow) lags after stimulus onset by ≈1.5 sec. (C) Cortical reflection change: 605-nm illumination. The response is biphasic, and its onset leads the LDF response by ≈1 sec. Long stimulus duration attenuates the second phase, which almost vanishes. Notice that increased reflection is downward. (D) The vascular response (“initial dip”) at different flow levels and at different times after the stimulus onset. We compare the early response to the short stimulus (black curve in C), when CBF was at equilibrium, with that obtained when CBF was elevated and a second delayed stimulus followed, by subtracting the short stimulus curve from the long stimulus curve (red curve in C). In D, when this difference, i.e., the net response to the second stimulus, shown in red, is shifted in time and superimposed on the response to the first stimulus (black line), the two curves are nearly identical. The second stimulus was given when CBF increased by ≈15%. (E) Cortical reflection change: 570-nm illumination. Similar to reflection changes at 605-nm illumination, the response onset leads the LDF response by 1 sec. The response is maintained throughout stimulus duration, for both short and long durations.

