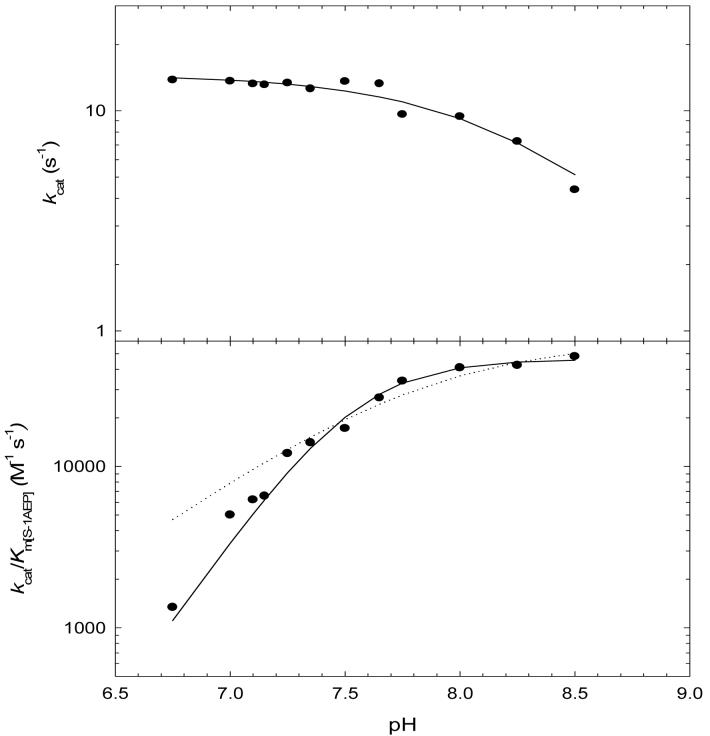
Figure 2.
Dependence of kcat and kcat/KS-1AEP on pH at saturating levels of acetyl-CoA and Ni2+. The dotted and solid lines are fits to Eqs 7 and 8, respectively. The kcat pH profile revealed the presence a single ionizable group with a pK value of 8.2 (± 0.1). The kcat/KS-1AEP profile was fit to Eq. 8, which describes the dependence on 2 groups with similar pK values of 7.5 (± 0.1) and Eq. 7, which describes the dependence on 1 group (dotted line).

