Figure 2.
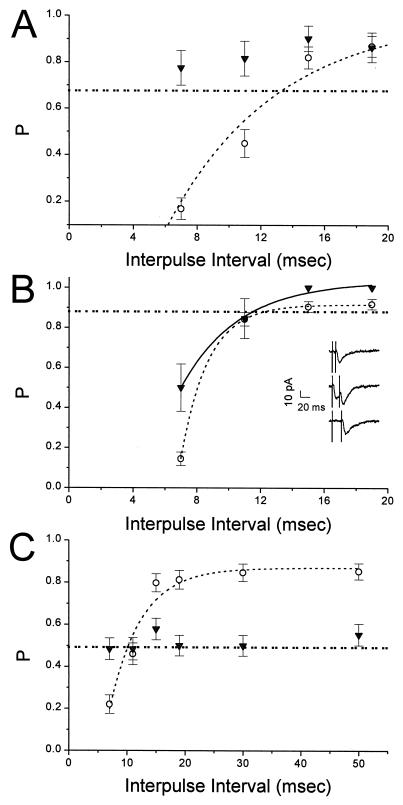
Time course of release probability after synaptic use. (A) Release probability for second stimulus in a pair as a function of interpulse interval. Probabilities when the first stimulus did not result in an exocytotic event (Pf) are plotted as solid triangles {n for each point ranges from 27 to 31; error bars represent estimated SD, [P(1 − P)/N]½}. Probabilities when the first stimulus did result in an exocytotic event (Ps) are plotted as open circles (n = 59 to 66). Ps as a function of time is fitted with an exponential decay (dashed line, recovery time constant = 7 msec), and the initial release probability of the synapse, indicated by the dotted line, was 0.675. In this synapse, Ps depresses markedly, illustrating the phenomenon of lateral inhibition; no other form of depression is evident. (B) As in A, for a synapse in which both Pf (solid triangles; n = 12 to 18) and Ps (open circles; n = 110 to 116) display depression; this synapse expresses inactivation as well as lateral inhibition. Both Ps and Pf are fitted with exponential decays, with recovery time constants of 1.7 (dashed line) and 3.6 msec (solid line), respectively, and the initial release probability (dotted line) was 0.88. (Inset) Sample traces from minimal stimulation experiments. Shown (from top to bottom) are responses to paired pulses with interpulse interpulse intervals of 7, 15, and 19 msec, respectively. Note the presence of release failures in the top and bottom traces. (C) As in A, for a synapse in which Pf (solid triangles; n = 92 to 106) does not facilitate, but Ps (open circles; n = 78 to 92) does, illustrating history-dependent facilitation. This synapse, like all synapses, displays lateral inhibition (but no inactivation) with a recovery time constant = 5.1 msec (dashed line); the initial release probability (dotted line) was 0.49.

