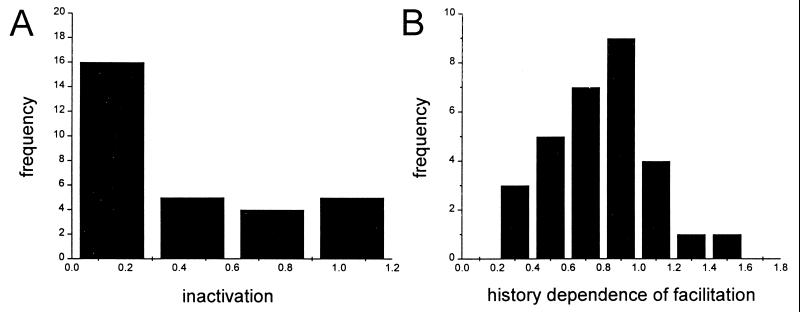
Figure 3.
Frequency histograms for two forms of paired-pulse modulation. (A) Occurrence frequency for each range of inactivation values (Pf at 7 msec divided by Pf at 19 msec). Half of the synapses (16 of 30) show nearly complete inactivation (inactivation value < 0.3). (B) Occurrence frequency plotted against history dependence of facilitation (Pf at 19 msec divided by Ps at 19 msec). Nearly half of the synapses (13 of 30) show no history dependence in their facilitation (values between 0.8 and 1.2), and half the synapses (15 of 30) facilitate significantly less when the first pulse fails to release a quantum of neurotransmitter than when it does release one.

