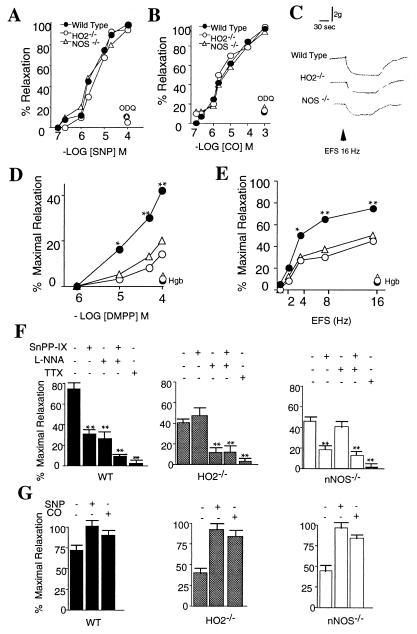
Figure 2.
Intestinal relaxation in mice lacking either HO-2 or neuronal NOS. (A and B) Concentration–response curves of enteric muscle from wild-type and mutant mice to SNP (10−7–10−4 M) and CO (10−7–10−3 M) and ODQ (10−5 M). Results are expressed as a percentage of the relaxation of wild-type muscle to SNP 10−4 M (100%). SE ranged between 5 and 11%, n = 5–7 (see Materials and Methods). Because the responses of congenic controls for either HO-2 or nNOS mutant mice were not statistically different, in all figures wild-type responses are expressed as an average of both HO-2+/+ and nNOS+/+ mice. (C) Typical traces from intestinal segments after EFS (16 Hz). (D and E) NANC relaxation in ileal segments after addition of DMPP (10−6–10−4 M) or EFS (2–16 Hz). Results are expressed as a percentage of the mean maximal relaxation achieved with SNP 10−4 M in wild-type tissues. SE ranged between 4 and 13%. (B–G) In each experiment, control strips were treated with SNP (10−4 M) as in A, and in all cases, maximal relaxations were essentially the same as in A. At the completion of each experiment, strips were treated with SNP 10−4 M to confirm the integrity of smooth muscle responses. Asterisks denote significant differences between wild-type responses and those of both HO-2Δ/Δ and nNOSΔ/Δ mice. Note: Strips were stimulated only once, and values represent the mean of seven to nine independent experiments. (∗, P < 0.05; ∗∗, P < 0.01 between wild-type mice and both nNOS and HO-2 mutants, ANOVA). Hgb, hemoglobin (10−3 M). (F) Effect of pharmacologic inhibition of NOS and HO on EFS-induced NANC relaxations in wild-type and mutant mice. Results are expressed as a percentage of the mean maximal wild-type relaxations to SNP 10−4 M in A. NANC relaxation was elicited with EFS (16 Hz, 2 ms) (n = 7). SnPP-IX, 10−5 M; L-NNA, 10−4 M; CO, 10−4 M; SNP, 10−4 M. SnPP-IX and L-NNA exerted no significant effects on baseline tensions. (G) Effect of CO and SNP on EFS-induced NANC relaxation. Results are expressed as a percentage of the mean maximal wild-type relaxations to SNP 10−4 M in A. (n = 7; ∗∗, P < 0.01, compared to untreated controls. Student’s t test for unpaired observations.) Experiments with DMPP yielded similar results.

