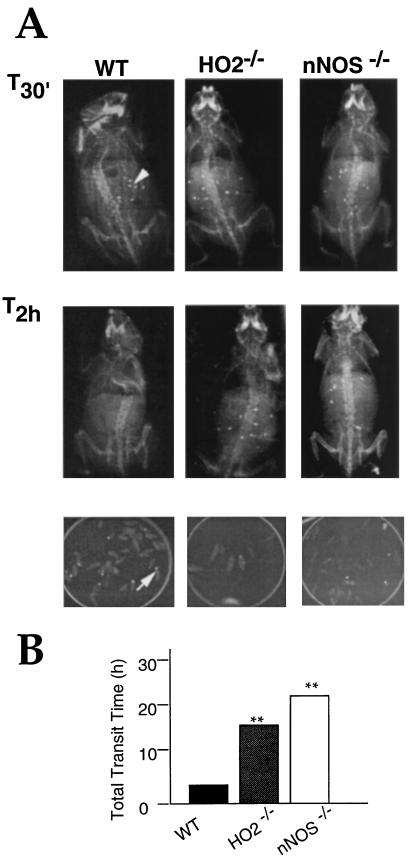
Figure 4.
Gastrointestinal transit in HO-2Δ/Δ and NOSΔ/Δ mice. (A) Ten to 15 radiopaque markers (arrow) were fed to mice and tracked by radiography at periodic intervals. Excretion of markers was also monitored by x-ray (Bottom). (B) Average time to excrete all markers. Results are expressed as number of hours from marker consumption to excretion. (∗∗, P < 0.01, n = 7–11. Student’s t test for unpaired observations.)

