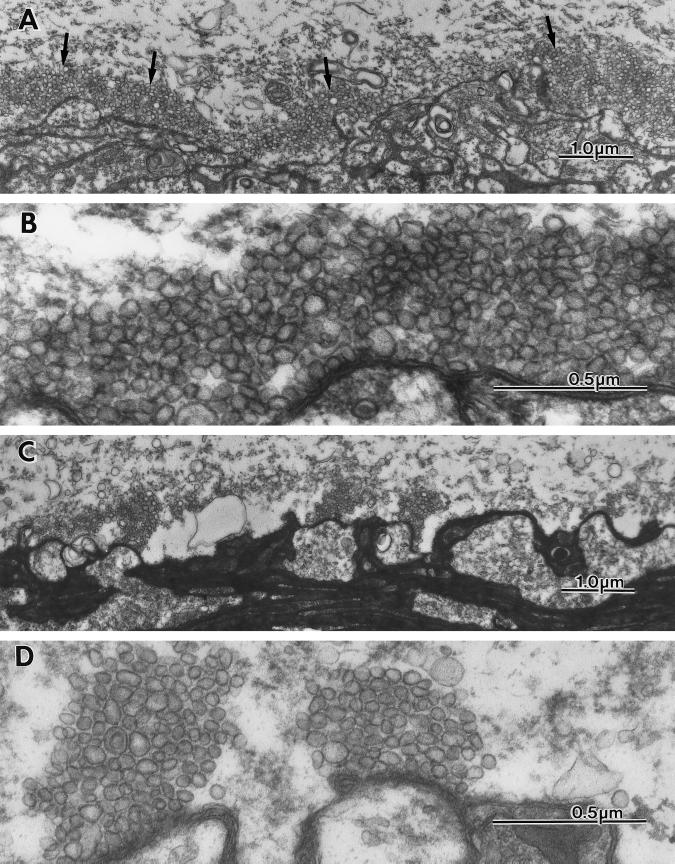
Figure 5.
Ultrastructural images of the presynaptic terminal following BoNTC1-LC microinjection. (A and B) Low and high magnification ultrastructural micrographs of the giant synapse showing presynaptic and postsynaptic elements and their spatial relation at the active zones after BoNTC1-LC microinjection. (A) Large numbers of vesicles cluster around the active zones. (B) Higher magnification of the same synapse to illustrate the large number and density of the synaptic vesicles abutting the active zone region. (C and D) Micrographs of a control synapse taken at similar magnification to illustrate the difference in vesicular distribution and number.

