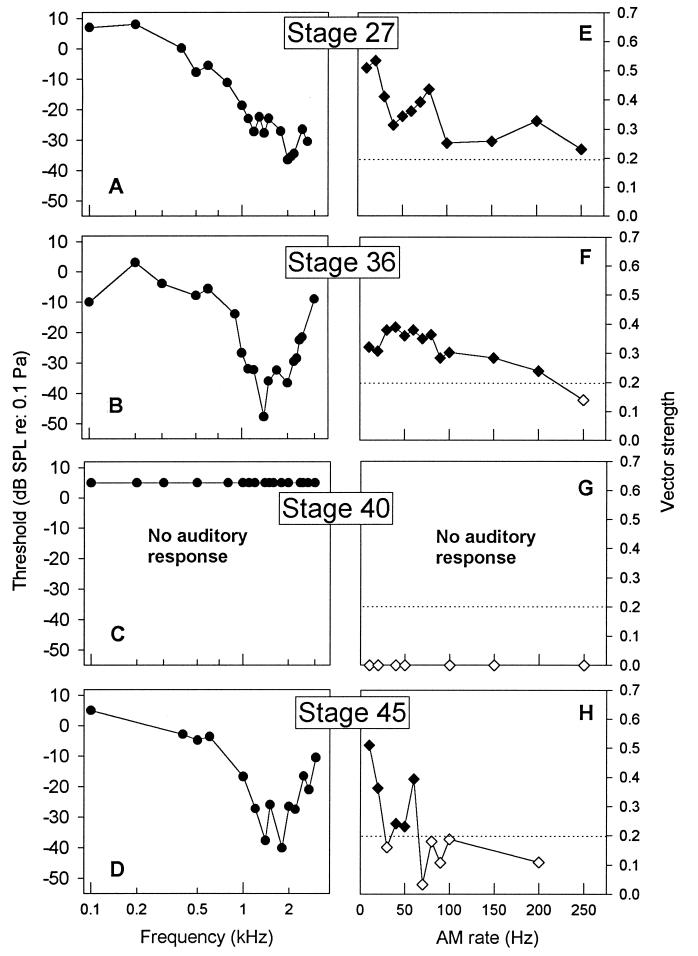
Figure 2.
(A–D) Midbrain audiograms plotting threshold in dB (re: 0.1 Pa) by tone frequency (kHz) for tadpoles at different metamorphic stages. Plotted are criterion responses to pure tones with frequencies from 100 to 3000 Hz, presented in random order. Each plot represents data from one representative animal. (E–H) Modulation transfer functions plotting vector strength of phase-locked response by AM rate for tadpoles at different metamorphic stages. AM rates were presented in random order. Signal intensity was maintained at −4 dB. Filled symbols (⧫) represent AM rates yielding significant phase locking based on the Rayleigh test (16), and open symbols (◊) represent nonsignificant responses. Horizontal dotted line is criterion for significant phase locking (P < 0.001). Audiograms and modulation transfer functions were derived from the same individual animals.

