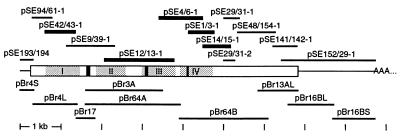
Figure 2.
Cloning of α1D cDNAs from the chicken’s basilar papilla and brain. Horizontal bars indicate the extent of each partial cDNA and are aligned with a diagram of the α1D mRNA in the middle. pSE… , PCR products from the basilar papilla; pBr… , clones from a brain cDNA library; rectangle, the ORF; AAA… , poly(A) tail; gray areas, homologous repeats I–IV; and black areas, the I-II-loop insert, the alternative IIIS2 segment, and the IVS2–3 insert in the basilar papilla. Thicker bars indicate products of PCRs with degenerate primers that were designed to amplify cDNAs of any L-type α1 subunit.

