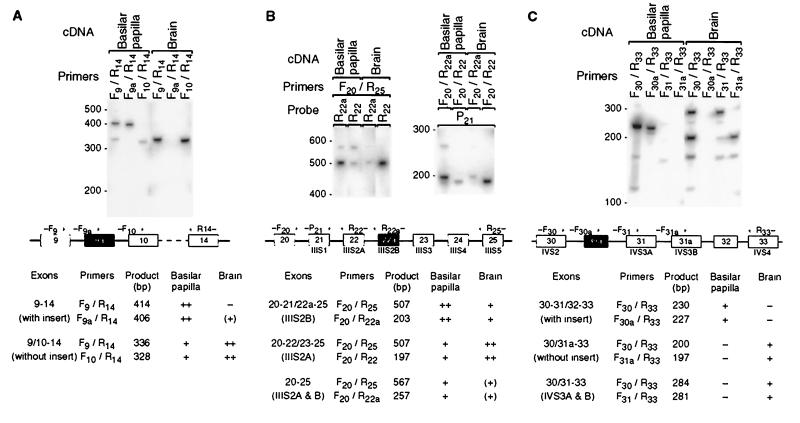
Figure 1.
Alternative splicing of the α1D mRNA in the basilar papilla and the brain. (A) Southern blot of PCR products amplified with primers flanking the insert in the I-II loop (exon 9a). Marker sizes in base pairs are indicated on the left. The diagram below of the putative genomic structure (not drawn to scale) depicts exons as rectangles, introns as horizontal lines, and PCR primers as arrows. To amplify all isoforms together, we used primers F9 and R14. To amplify rare isoforms without interference from more abundant ones, we used exon-specific primers: primer F9a binds across the splice junction of exons 9 and 9a, and primer F10 binds across that of exons 9 and 10. The table at the bottom lists product size and occurrence for each splice variant and primer pair. ++, abundant; +, detectable; (+), barely so; −, not detectable. (B) Same as A, but for the alternative IIIS2 segment (exon 22a). Note the abundance in the basilar papilla of mRNAs with exons for both IIIS2 segments. (C) Same as A, but for the insert in the IVS2–3 loop (exon 30a). Primer F30a binds across the splice junction of exons 30 and 30a, primer F31 binds across that of exons 30 and 31, and primer F31a binds across that of exons 30 and 31a. For the basilar papilla, the lengths of even the minor products were consistent only with splice isoforms containing exon 30a; for the brain, they were consistent only with isoforms lacking exon 30a. Note the abundance in the brain of mRNAs with exons for both IVS3 segments.

