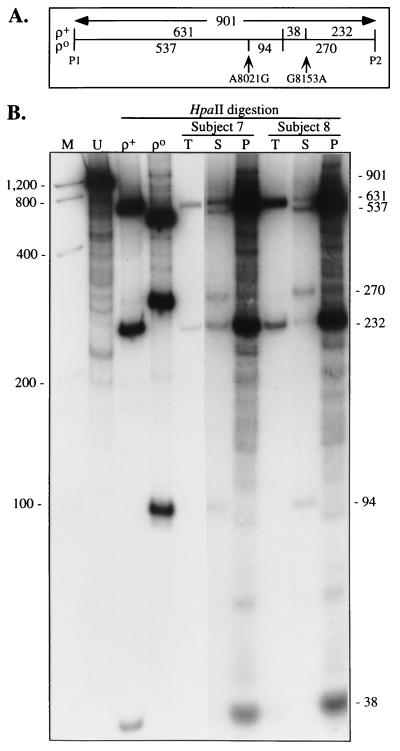
Figure 2.
PCR/RFLP analysis of the COX II region. (A) Schematic of the HpaII digestion pattern of the COX II region amplified from ρ+- and ρo-derived DNA by using the COX II primers (P1 and P2). The HpaII sites (interior vertical lines), the location of the two HpaII polymorphisms, and the predicted sizes of the HpaII-digested fragments, in bp, are shown. (B) Autoradiogram of HpaII-digested 0.9-kb PCR products of ρ+ and ρo DNA and of total cellular DNA (T), DNA from the supernatant (S), and DNA from the pelleted cell debris (P) after 10 min of boiling of the buffy coat from the blood of an AD patient (subject 7) and a control (subject 8), by using primers corresponding to the COX II gene. Sizes of expected fragments, in bp, are at right. U, uncut PCR product from ρ+ DNA. Other notations are as in Fig. 1. The photo is a composite of two exposures of the same gel.

