Figure 3.
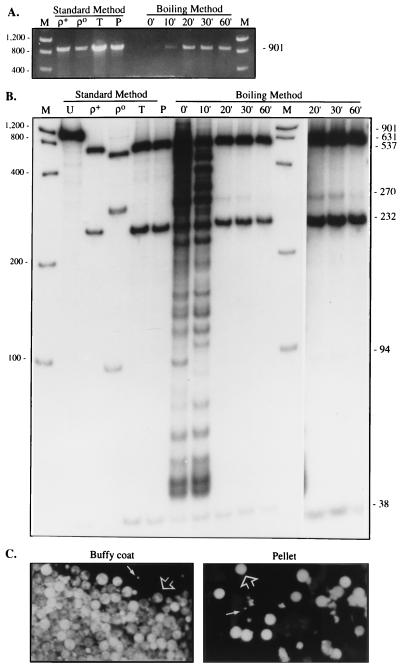
Time course of boiling. (A) The buffy coat pellet from subject 1 was resuspended in water, boiled for the indicated times, amplified with the COX II primers, and electrophoresed through an agarose gel; equal amounts of PCR product were loaded in each lane. DNA from ρ+ and ρo cells, and the total cellular DNA (T) and pelleted buffy-coat DNA after 10 min of boiling (P), all isolated by the standard method, are also shown. (B) The samples shown in A were digested with HpaII and electrophoresed through a nondenaturing polyacrylamide gel. Note the decline of the 270-bp and 94-bp fragments at the later time points (more clearly visible in the original autoradiogram, and in the darker exposure of the 20-min, 30-min, and 60-min results shown in the last three lanes). Other notations are as in Fig. 2. (C) Micrographs of resuspended cells from the buffy coat prior to boiling (the cells were clumped and difficult to disaggregate) and of the resuspended pellet after 10 min of boiling, after staining with MitoTracker. Note the mixed population of lymphocytes (large arrows) and platelets (small arrows). (×400.)

