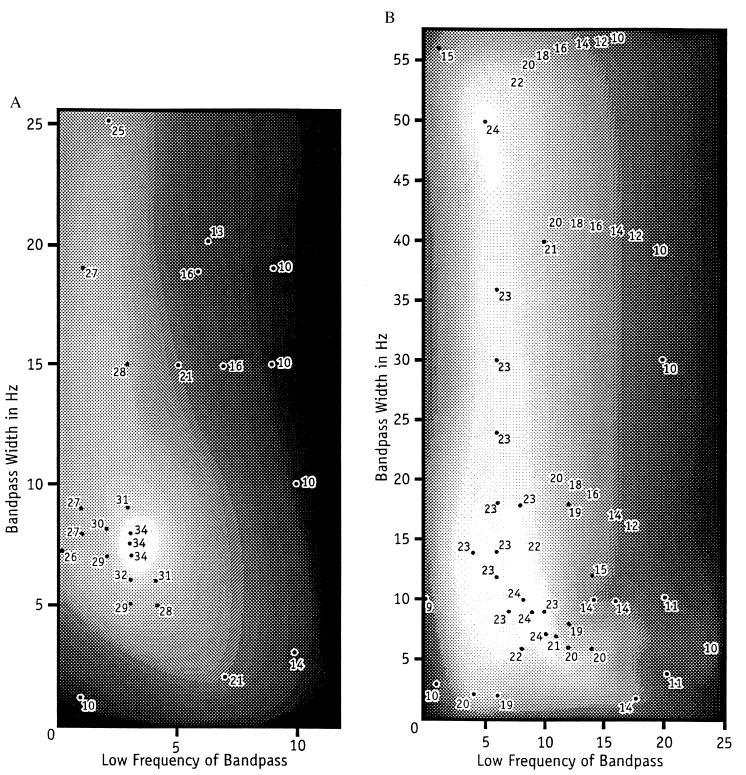
Figure 1.
Shaded contour maps of recognition-rate surfaces. The x-coordinate is the low frequency in Hz of a filter and the y-coordinate is the width in Hz of the filter. The number plotted at a point on the map is the number of test samples of words correctly recognized out of a total of 35 such samples by the Butterworth filter with the coordinates of the point.

