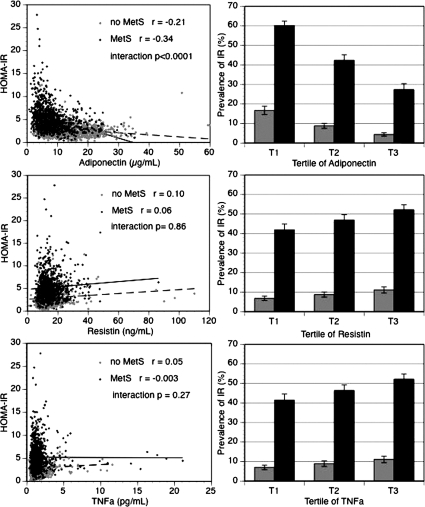
Figure 1.
Adverse adipokine levels are associated with insulin resistance in individuals with metabolic syndrome (MetS) and without (no MetS). The left-hand column shows scatter plots (crude data) of plasma adiponectin (top), resistin (middle), and TNF-α (bottom) in relation to insulin resistance measured by HOMA-IR according to metabolic syndrome status (gray circle, no MetS; black circle, MetS; dashed line, no MetS; solid line, MetS). The right-hand column shows the prevalence (and ses) of insulin resistance (IR) (age-sex adjusted) defined by HOMA-IR greater than 75th percentile in relation to adipokines grouped into tertiles of increasing plasma concentration, according to metabolic syndrome status (light gray, no metabolic syndrome; dark gray, metabolic syndrome). For trends within metabolic syndrome categories, P < 0.0001 for decreasing prevalence of insulin resistance across adiponectin tertiles in both groups; for resistin (middle) and TNF-α (bottom), all P < 0.01 for trends in insulin resistance prevalence across tertiles in both groups.

