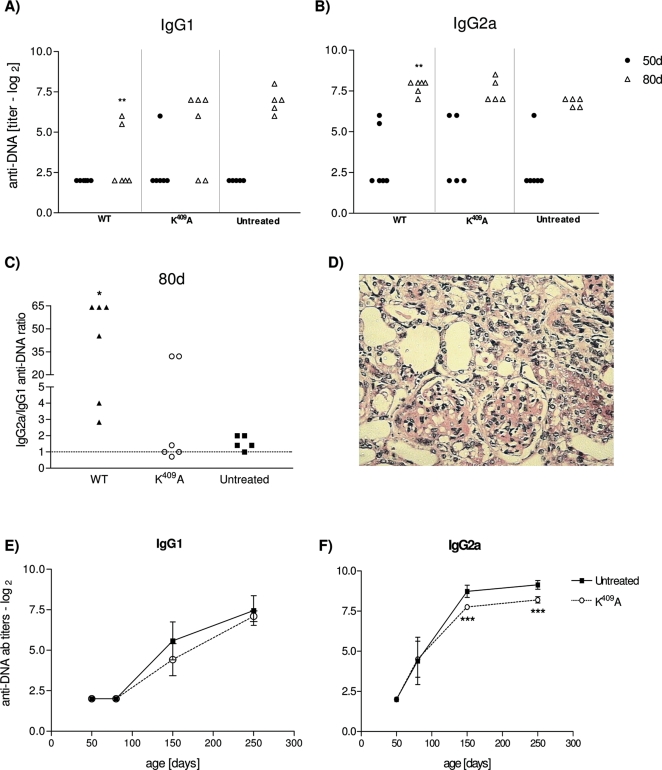
Figure 2. WT and K409A rHsp65 treatment in anti-DNA antibody response.
Anti-DNA IgG1 [A] and IgG2a [B] isotypes antibody production and the IgG2a/IgG1 antibody ratio [C] in the serum of treated and untreated [NZBxNZW]F1 mice [n = 5–6/group]. Representative renal histological appearance from 4 to 5-month-old F1 mice; light microscopy 100× [D]. Time-course production of anti-DNA IgG1 [E] and IgG2a [F] antibodies in untreated and K409A mice. Untreated group has been the reference group for unpaired t-test analysis; *p<0.05; **p<0.01; ***p<0.001. Results are representative of 3 independent experiments.

