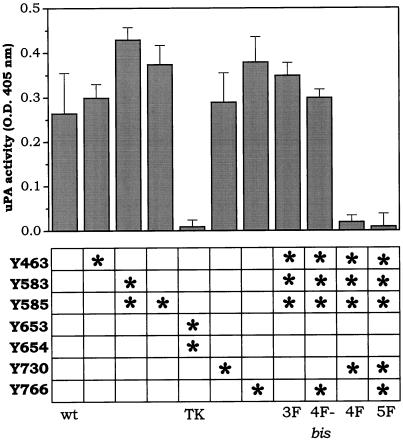
Figure 2.
uPA-inducing capacity of different FGFR1 mutants. L6 myoblasts were independently transfected with wt-FGFR1 or with the FGFR1 mutants described in the bottom panel. In each column, an asterisk or asterisks mark the tyrosine autophosphorylation site(s) mutagenized to phenylalanine in the different mutants. Each cell line was stimulated with 100 ng/ml FGF2, and 24 h later cell-associated uPA activity was evaluated (top panel). For each cell line, uPA activity measured in the corresponding nonstimulated cells (ranging from 0.1 to 0.2 OD at 405 nm) was subtracted. Results represent the mean ± SD of two independent experiments in triplicate. For each mutant, similar results were obtained for two independent clones.

