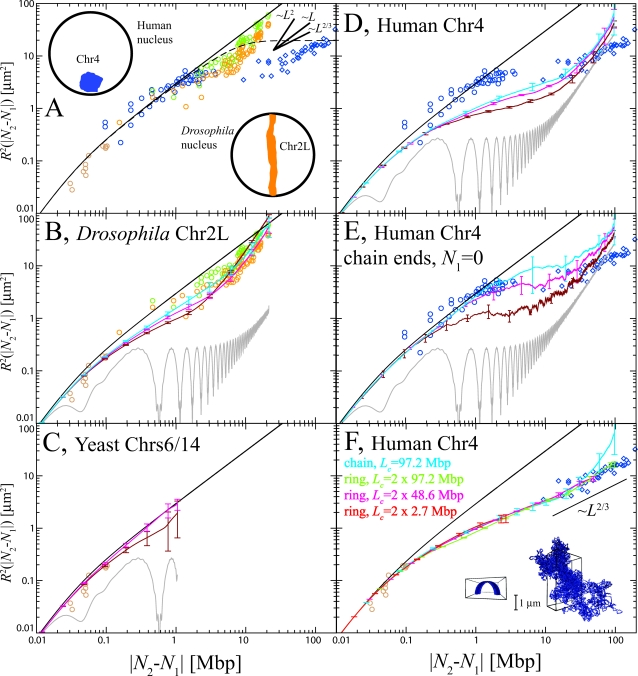
Figure 1. Experimental FISH data for spatial distances R 2(|N 2−N 1|) between targeted chromosome sites compared to the estimates based on the WLC model (A) and results from our simulations (B–F).
Brown ○: Saccharomyces cerevisiae Chr6 and Chr14 [16]. Blue ○ and ◊: Homo Sapiens Chr4, |N 2−N 1|<4.5 Mbp and |N 2−N 1|>4.5 Mbp, respectively [17]. Orange and green ○: Drosophila melanogaster Chr2L, DS5 and DS1 embryos respectively [18]. DS5 and DS1 are two phases of cell cycle. DS1 appears later. Black continuous line: Mean-square internal distances predicted by the WLC model, Equation 1. (A) Black dashed line: Mean-square internal distances of an ideal polymer chain inside a spherical nucleus of 5 µm radius [7]. (The exact probability distribution function of the square internal distances R 2(|N 2−N 1|) of a polymer without self-interactions obeys diffusion equation [7] with null boundary conditions (in our case the boundary is the sphere which models the nucleus).)While data for Chr4 and Chr2L show a reasonable agreement at short-length scales, the apparent large-length scale Chr4 behavior L 2/3 [29] contrasts with the observed L 2 for Chr2L. The insets show two schematic drawings of the Chr4 territory in a human nucleus (blue) and of Chr2L in Rabl phase in a Drosophila nucleus (orange). (B–E) Gray lines represent internal distances in the initial, “metaphase-like” chromosome configuration (Materials and Methods). Internal distances in simulated chromosomes have been averaged over 3 time windows of exponentially growing size: 240 s<t<2,400 s (dark red line), 2,400 s<t<24,000 s (magenta line) and 24,000 s<t<240,000 s (cyan line). Since yeast chromosomes rapidly equilibrate only averages over the first 24,000 s are here reported (panel C). In panel E, N 1 = 0, i.e., has been fixed at the origin of the chain to make equilibration of the chain ends evident. (F) Data from simulations of three ring polymers of decreasing half-size L c = 97.2, 48.6, and 2.7 Mbp (green, magenta and red lines respectively). Mean distances seem to extrapolate to an effective power law ∼L 2/3. Inset: Initial (left) and final (right) conformation of a (randomly chosen) half of the largest (2×97.2 Mbp) simulated ring chromosome.

