Figure 2.
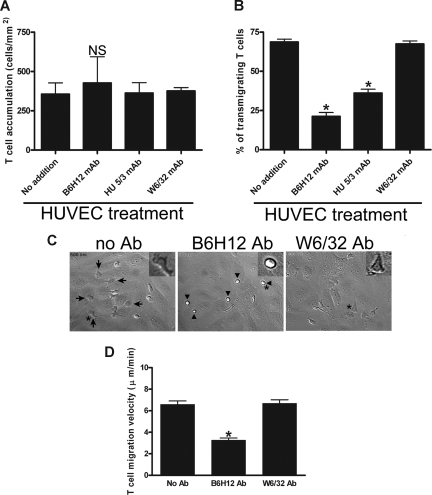
Endothelial cell CD47 mediates TEM of T cells. (A) HUVEC monolayers stimulated with TNF-α for 4 hours were preincubated with function blocking mAb to CD47 (B6H12), ICAM-1 (HU5/3), or a nonblocking control mAb to MHC class I (W6/32) at 37°C for 30 minutes (30 μg/mL each). Before perfusion of T cells, TNF-α–stimulated HUVECs were treated with SDF-1α at 37°C for 15 minutes. The total number of accumulated T cells was determined as detailed in “Methods.” NS indicates P > .05. (B) TNF-α–stimulated HUVEC monolayers were preincubated with a CD47 (B6H12), ICAM-1 (HU5/3) mAb, medium alone (no additions), or MHC-class I mAb at 37°C for 30 minutes. The percentage of T cells that transmigrated after 10 minutes was determined by live cell imaging as described earlier.22 Data are means (± SEM) of 4 separate experiments; * indicates statistically significant difference (P = .001). (C) DIC images of live cells in the TEM assay after 10 minutes were produced as described in “T-cell locomotion and transmigration assay under flow.” The polarity of T cells on untreated (no Ab; left,  ), B6H12 (middle, ▶), and control W6/32 (right) mAbs are shown. Arrows show migrated CD3+ cells in medium-treated monolayers. In contrast, T cells (▶) on B6H12-treated monolayers exhibit a rounded-up morphology and defects in migratory behavior. (Inset) A higher magnification of a single T cell during TEM is shown in the right upper corner of each DIC image to better show the differences in morphology in the presence or absence of a blocking CD47 antibody. (D) The migration velocity of T cells perfused on a HUVEC monolayer treated with B6H12 or W6/32 mAb or left untreated was determined using Image J software. *P = .01 versus W6/32 mAb.

