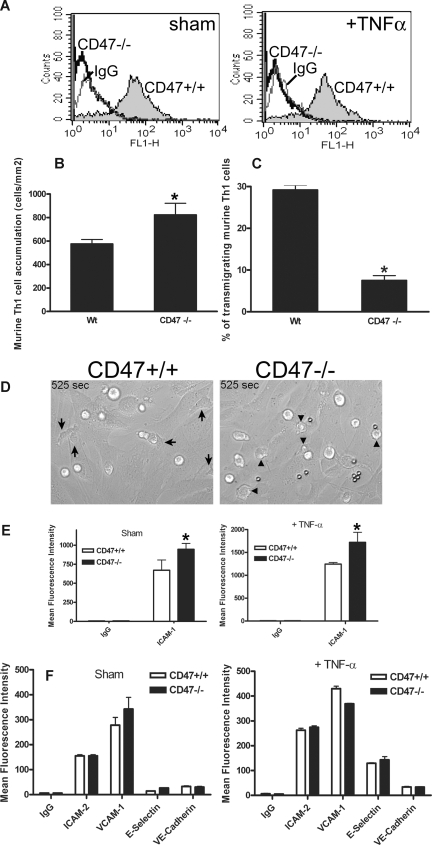
Figure 6.
CD47−/− MHECs have impaired T-cell transmigration. (A) Expression of mouse CD47 in WT and CD47−/− MHECs before (left) or after TNF-α (right). The gray solid lines represent a nonbinding isotype control mAb. (B) Isolated mouse Th1 cells prepared from naive WT mice (2 × 10⁶ cells/200 μL) were added as a bolus, and the total number of accumulated T cells was determined 10 minutes after perfusion as detailed in “Methods.” Data are means (± SEM) of 4 separate experiments; *indicates statistical significant difference (P < .001). (C) Mouse WT Th1 cell transmigration of MHECs from WT or CD47−/− mice was performed as described in “Methods.” Data are means (± SEM) of 4 separate experiments; * indicates statistical significant difference (P = .001) were prepared as described in “T-cell locomotion and transmigration under flow.” (D) DIC images from live cell imaging of T-cell TEM were prepared as described in “T-cell locomotion and transmigration under flow.” The images show differences in the morphology of T cells on WT (left) versus CD47−/− MHEC monolayers.  identify migrated CD3+ cells (left), and ▶ show CD3+ cells with a rounded-up morphology and impaired apical migration on TNF-α stimulated CD47−/− MHEC (right). (E,F) WT and CD47−/− MHECs were stained for listed adhesion molecules in the presence (right) or absence (left) of TNF-α and analyzed by flow cytometry. Expression levels were shown in histograms and quantitated as mean fluorescence intensity. Data are means (± SD), n = 3 independent MHEC preparations; indicates statistical significant difference (P = .001).

