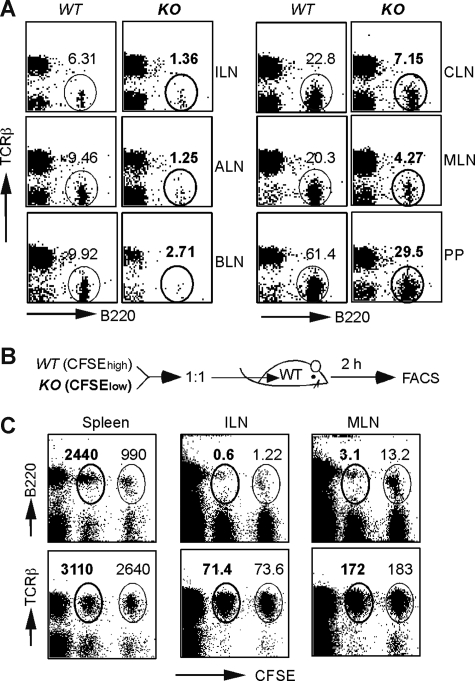
Figure 2.
Defective migration of HSP90b1 KO B cells to lymph nodes. (A) Phenotypic analysis of B- and T-cell distribution in LNs of WT and KO mice. Numbers indicate the percentage of gated cells over the total. (B) Schematic diagram of the in vivo migration experiment. (C) Phenotypic analysis of adoptively transferred B and T cells of WT (CFSEhigh) and KO (CFSElow) mice in WT recipient mice 2 hours after transfer. Numbers (× 103) represent the events of gated cells over the total number of live cells in each organ, including spleen (5 × 10⁷), ILN (3 × 10⁶), and MLN (7.5 × 10⁶).

