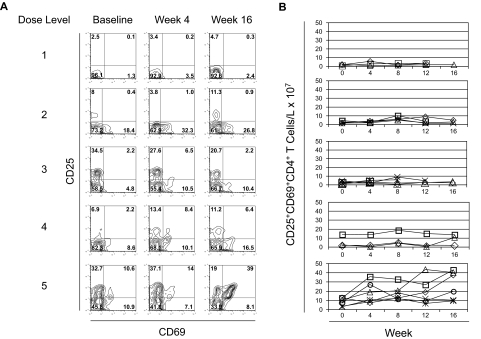
Figure 2.
Activation of CD4+ T cells with escalating doses of anti-CTLA4 antibody. (A) PBMCs at baseline, week 4, and week 16 of treatment from study subjects in each dose level were stained with antibodies to CD4, CD25, and CD69. Stained cells were then assessed by flow cytometry and gated on CD4+ T cells. Each row represents a different dose level. Numbers on plots represent the percentage of cells for each quadrant. Individual study subjects are presented from each dose level. Gating for CD25 and CD69 expression was set with results from staining with isotype-matched control IgG. (B) The counts of CD25+CD69+ CD4+ T cells per volume of blood was calculated by multiplying the percentage of CD25+CD69+CD4+ T cells by the absolute lymphocyte counts measured simultaneously. Each row represents the corresponding dose level. Each line represents the counts for each evaluable subject within the specified dose level.

