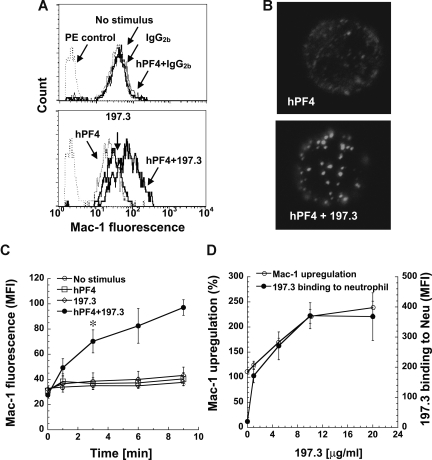
Figure 1.
Costimulation with human PF4 (hPF4) and anti-PF4 mAb induces dose-dependent Mac-1 up-regulation. Human neutrophils were incubated with hPF4 in the presence or absence of 197.3 or IgG2b isotype control. Cell surface Mac-1 expression and 197.3 binding to cells was quantified in fixed samples using PE-conjugated anti–Mac-1 mAb and Alexa 488–conjugated goat anti–mouse F(ab′)2 IgG, respectively. (A) Mac-1 expression 9 minutes after addition of 2 μM hPF4, 10 μg/mL 197.3, 10 μg/mL IgG2b, or their combinations. PE control represents nonbinding IgG control. Costimulation with hPF4 and anti-PF4 resulted in enhanced Mac-1 expression. (B) In the top panel, neutrophils were incubated with 2 μM hPF4 for 9 minutes and fixed. PF4 distribution on fixed cells was determined by incubation with 197.3 followed by Alexa 488 F(ab′)2 goat anti–mouse IgG. In the bottom panel, neutrophils were incubated with 2 μM hPF4 and 10 μg/mL 197.3 prior to fixation. Fixed sample was then incubated with Alexa 488 F(ab′)2 goat anti–mouse IgG. Clustering of PF4 was observed in right panel only. (C) Time kinetics of Mac-1 surface expression following various treatments: no stimulus (○), 2 μM hPF4 alone (□), 10 μg/mL 197.3 alone (◇), and 2 μM hPF4 plus 10 μg/mL 197.3 costimulation (●). Absolute geometric mean fluorescence intensity (MFI) data are presented. Costimulation resulted in significant Mac-1 expression beyond 3 minutes (*P < .01). (D) In studies where 197.3 dose was varied and PF4 dose was fixed at 2 μM, Mac-1 expression (left axis) was observed to vary in proportion to 197.3 binding to neutrophils (right axis). Mac-1 up-regulation (%) represents percentage change in Mac-1 levels on neutrophils in treatment runs versus no-stimulus controls. Error bars represent SEM (n ≥ 3).

