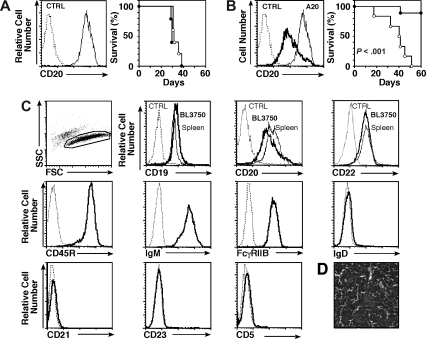
Figure 1.
In vivo model of lymphoma immunotherapy. Survival of mice given (A) A20 cells, or (B) BL3750 tumor cells from a cMycTG+/− mouse. Left panels: CD20 expression by tumor cells (thick line) and the A20 cell line (thin line) assessed by immunofluorescence staining with flow cytometry analysis. Right panels: Mouse survival following subcutaneous transfer of 106 A20 or 105 BL3750 lymphoma cells on day 0. All mice were given CD20 (•) or control (○) mAb intravenously (250 μg/mouse) on day 1 (n = 4-9 mice/group). (C) Cell surface immunophenotype of BL3750 cells evaluated by immunofluorescence staining with gating on live cells as identified by forward/side light scatter as shown. Comparisons of CD19, CD20, and CD22 expression by BL3750 cells (thick line) and spleen B220+ cells (thin line) from cMycTG+/− mice was assessed by 3-color analysis. Cell surface expression of CD45R (B220), IgM, FcγRIIB, IgD, CD21, CD23, and CD5 (thick line) was assessed by 2-color analysis. Results represent those obtained in 3 independent experiments. (A-C) Background staining using a control (CTRL) mAb is shown (dashed line). (D) Hematoxylin and eosin staining of a lymph node tissue section 28 days after mice were given BL3750 cells. Results represent those obtained in 3 mice. Image was acquired with an Olympus BX60 microscope (Olympus, Center Valley, PA; magnification 40×/1.00 oil iris) and Camera SPOT 1.3.0 (Diagnostic Instruments, Sterling Heights, MI). Image was processed with SPOT 4.0.4 (Diagnostic Instruments) and Adobe Photoshop CS2, version 9.0.2 (Adobe Systems, San Jose, CA).

