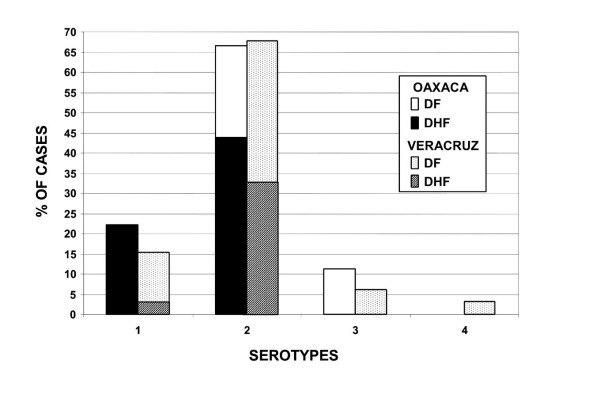
Figure 3.
Summary of all DENV analyzed in this study. The percentages of DENV-1, 2, 3 and 4 detected in Oaxaca and Veracruz States during outbreaks in 2005–06. The graph shows that the relative percentages of DENV-1, 2, 3 and 4 do not differ between Oaxaca and Veracruz, although the numbers of samples analyzed were different.

