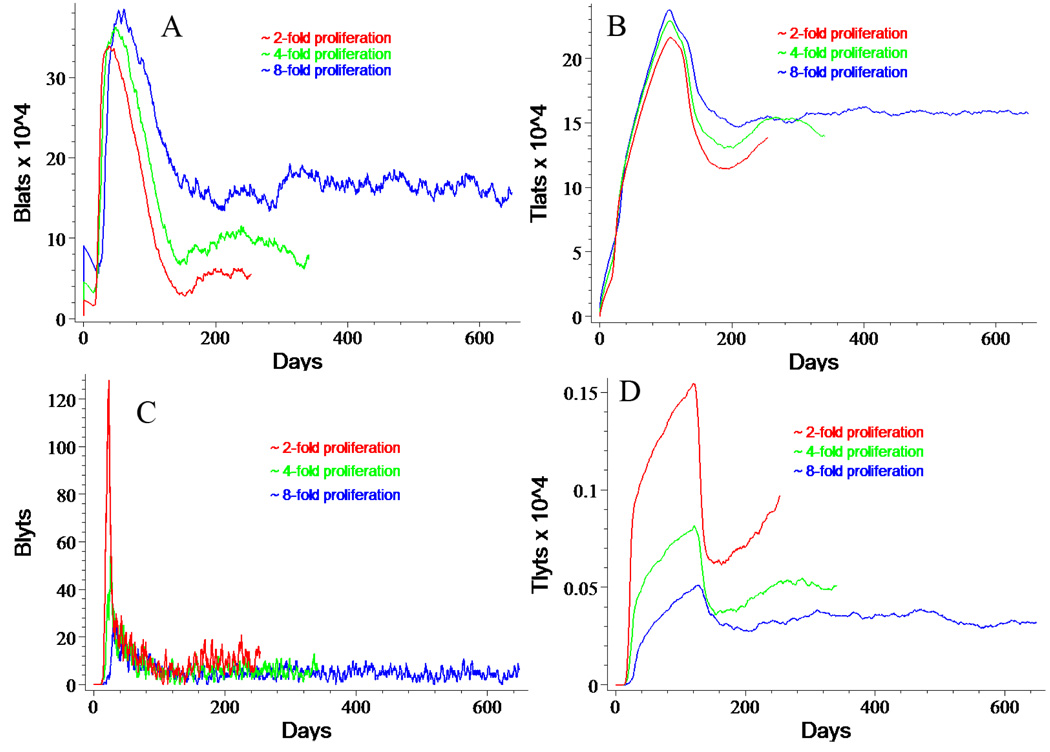
Figure 6. Effects of Cell Division after Initial Infection.

Panels A and C illustrate the effects of allowing 1 (red), 2 (green), or 3 (blue) rounds of cell division immediately following initial infection on the numbers of BLat and BLyt, respectively. While BLat populations grow, BLyt populations actually shrink. Cognate virtual CTLs show parallel behavior.
