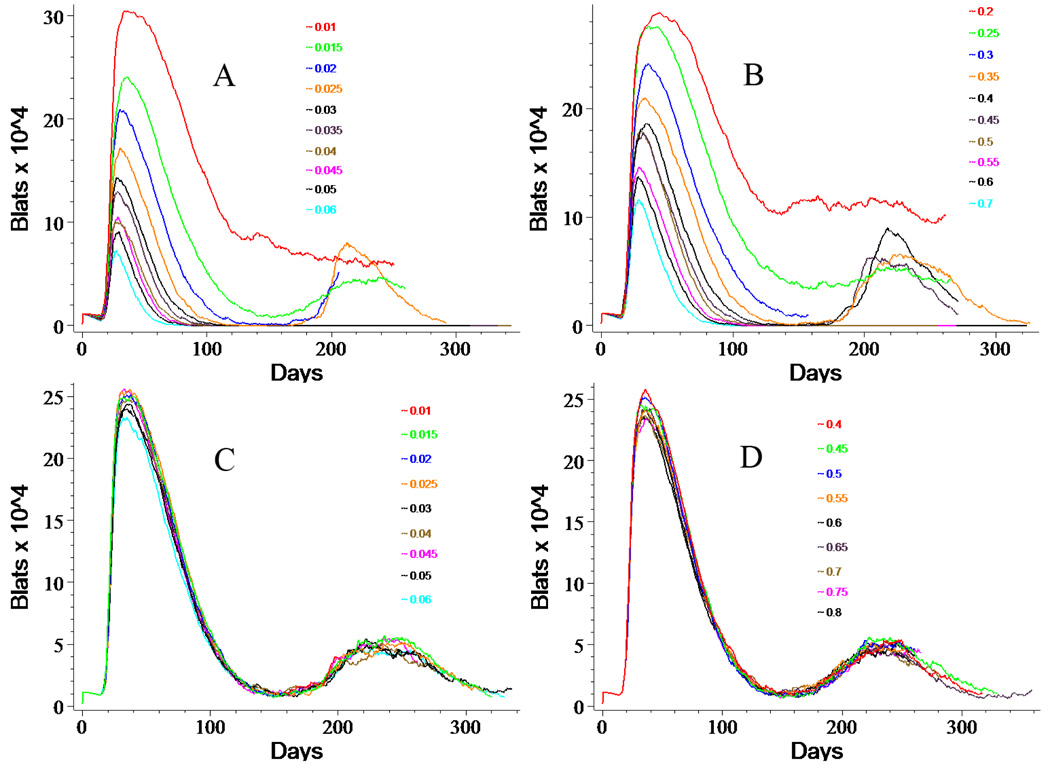
Figure 7. Responses of BLatS to Changes in CTL Parameters.

Varying TLat activation rate (A) or kill rate (B) or TLyt activation rate (C) or kill rate (D) results in the changes illustrated above in BLat populations. Increasing either the activation or kill rate of TLatS decreases the BLatS ultimately resulting in clearance at the highest values of either of the two parameters, while for TLytS increasing these two parameters has no significant effect on the BLat population. The legend indicates the probability of the event (activation or kill, respectively), where 1.0 corresponds to 100%. The default values for activation are TLat=0.015 and TLyt=0.035, while those for killing are TLat=0.30 and TLyt=0.60.
