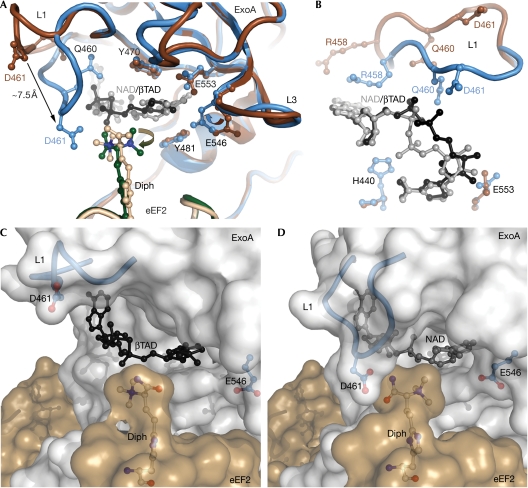
Figure 3.
The NAD+ binding pocket. (A) A comparison of the NAD+-binding site in the eEF2–ExoAc–βTAD complex and the eEF2–ExoAc(R551H)–NAD+ mutant complex. In the eEF2–ExoAc–βTAD complex, ExoAc is shown in dark brown, eEF2 in light brown and βTAD in black. In the eEF2–ExoAc(R551H)–NAD+ complex, ExoAc is shown in blue, eEF2 in dark green and NAD+ in grey. Residues involved in coordinating NAD+ are shown as a ball-and-stick representation. (B) Conformation of L1, and the NAD+ and βTAD legends in the NAD+-binding site as viewed from the diphthamide residue. When compared with (A), the view is rotated −90° around the x axis and 90° around the z axis. Residue and legend colours are as shown in (A). (C) Transparent surface representation of the complex. Open conformation of L1 (blue cartoon with Asp 461 (D 461) in a ball-and-stick representation) in the eEF2–ExoAc–βTAD complex. The βTAD (black), the diphthamide (white carbons) and the ExoAc E551H (blue) are shown as a ball-and-stick representation. (D) Closed conformation of L1 in the eEF2–ExoAc(E551H)–NAD+ complex. The colouring is as in (C), except for NAD+ (grey ball and stick). ExoA, exotoxin A; eEF2, elongation factor 2; L, loop.

