
Figure 1.
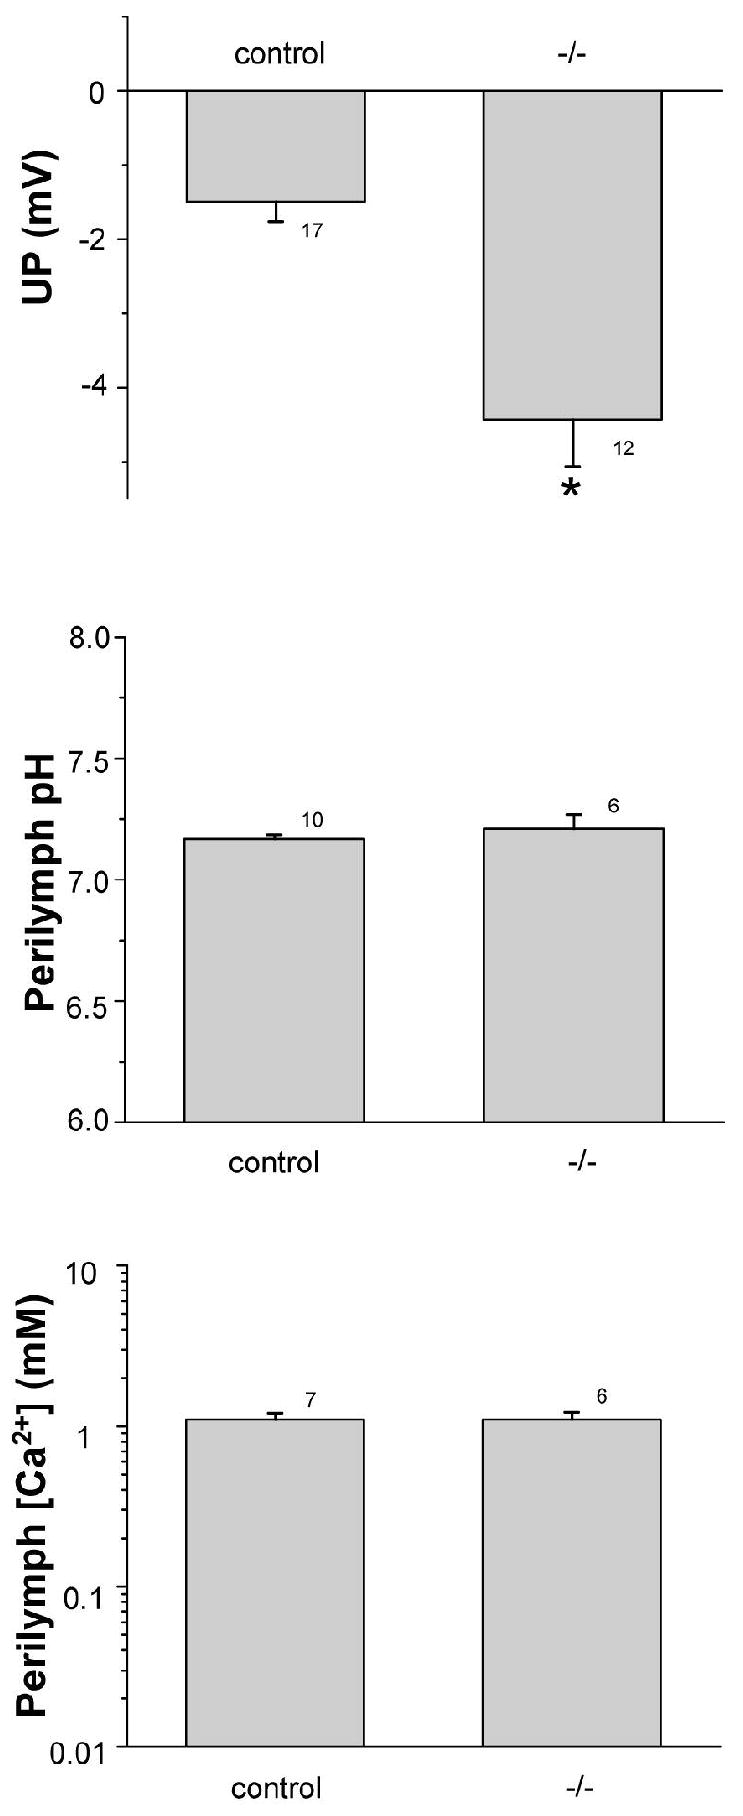
Utricular endolymphatic potential (UP), perilymphatic pH and [Ca2+]. (Top panel) UP of pooled (Control) wild-type (Slc26a4+/+; n=8) and heterozygous (Slc26a4+/-; n=9) and of knockout (Slc26a4-/-) mice. *, P < 0.05 . (Middle panel) perilymphatic pH of control and knockout mice; no significant difference (P > 0.05). (Bottom panel) perilymphatic [Ca2+] of control and knockout mice; no significant difference (P > 0.05). Number of measurements at each bar.