
Figure 2.
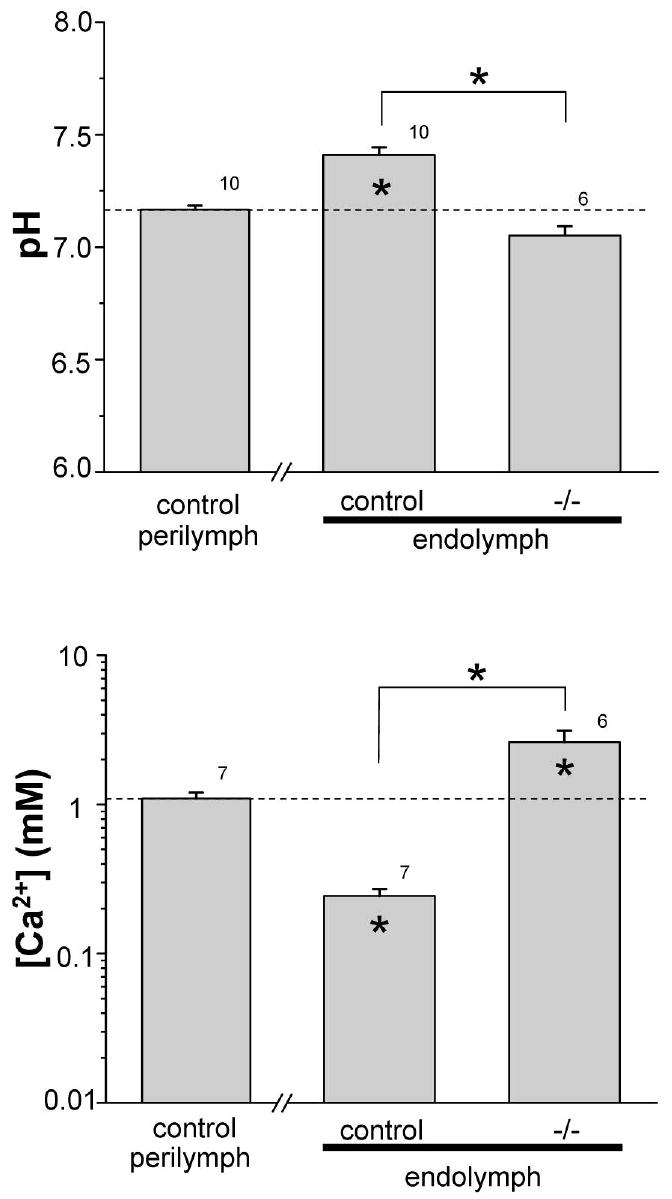
Endolymphatic pH and [Ca2+]. (Top panel) endolymphatic pH of control and knockout (-/-) genotypes compared to control perilymphatic pH (dotted line). (Bottom panel) endolymphatic [Ca2+] of control and knockout (-/-) genotypes compared to control perilymphatic pH (dotted line). * inside bars, P < 0.05 versus perilymphatic pH or [Ca2+]; * above bars, P < 0.05. Number of measurements at each bar.