
Figure 5.
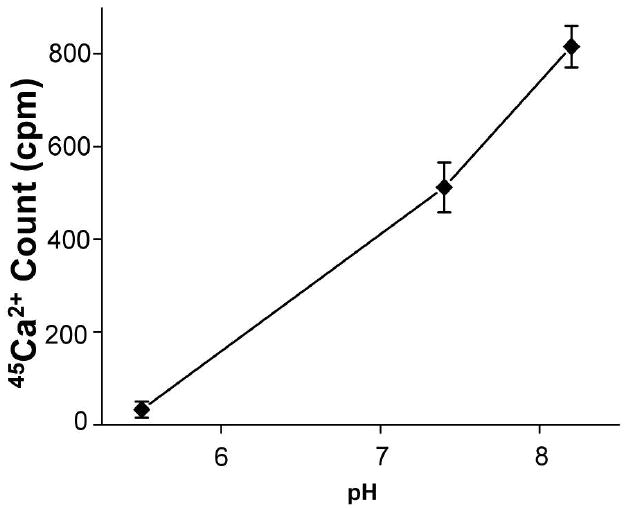
Net 45Ca2+ uptake under the different apical pH. Measured after a 15 minute incubation with the pH of 5.5, 7.4, 8.2. All cells were incubated with 1,25(OH)2D3 (100 nM, 24 hr) before the measurement (n = 6). Uptakes are expressed as count per minute (cpm).