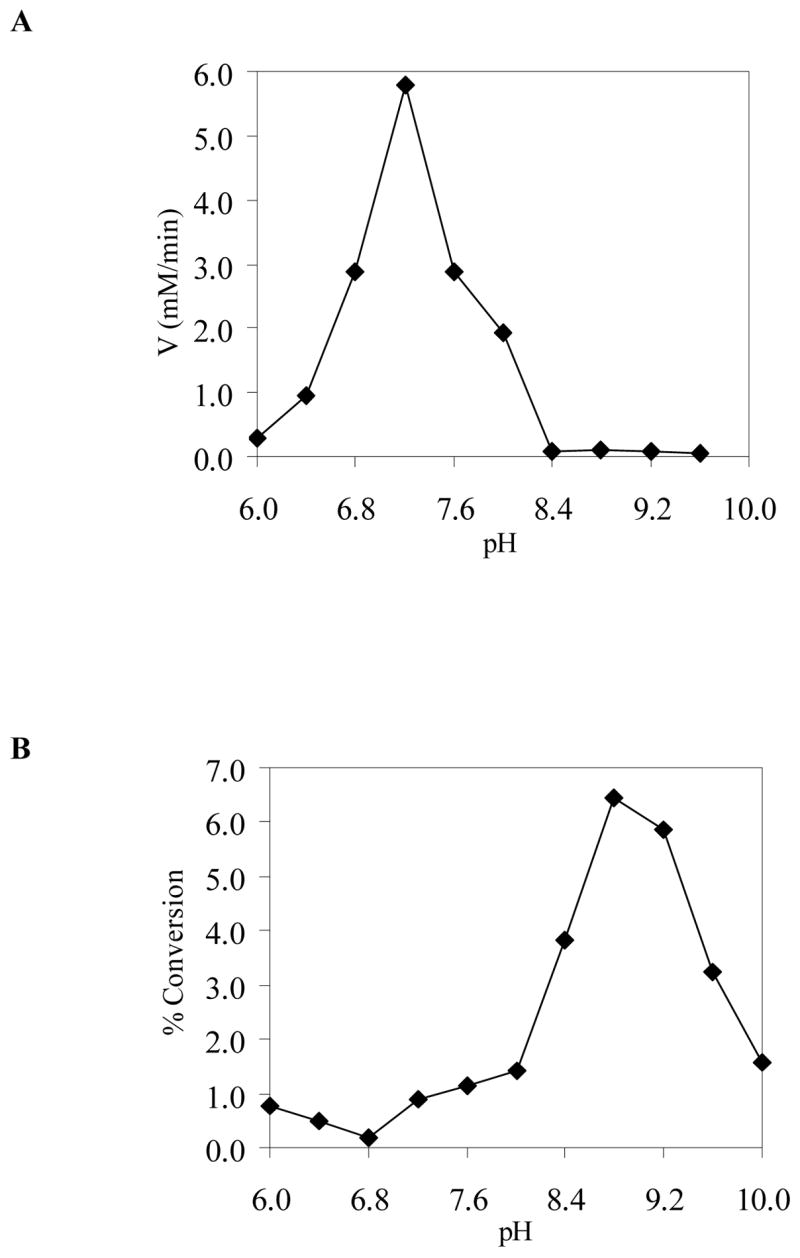
FIGURE 4.

The pH dependence of enzyme activity. All reactions (50 μL total volume) were carried out in 50 mM potassium phosphate buffer for pH 6.0–7.6, in 20 mM Tris·HCl buffer for pH 8.0–8.8, and in 50 mM glycine-NaOH solution for pH 9.6–10.0. (A) Reaction included UDP-GlcNAc (2), NAD+, and TviB. (B) Reaction included UDP-GlcNAcA (4) and TviC. See the Experimental Procedures for details.
