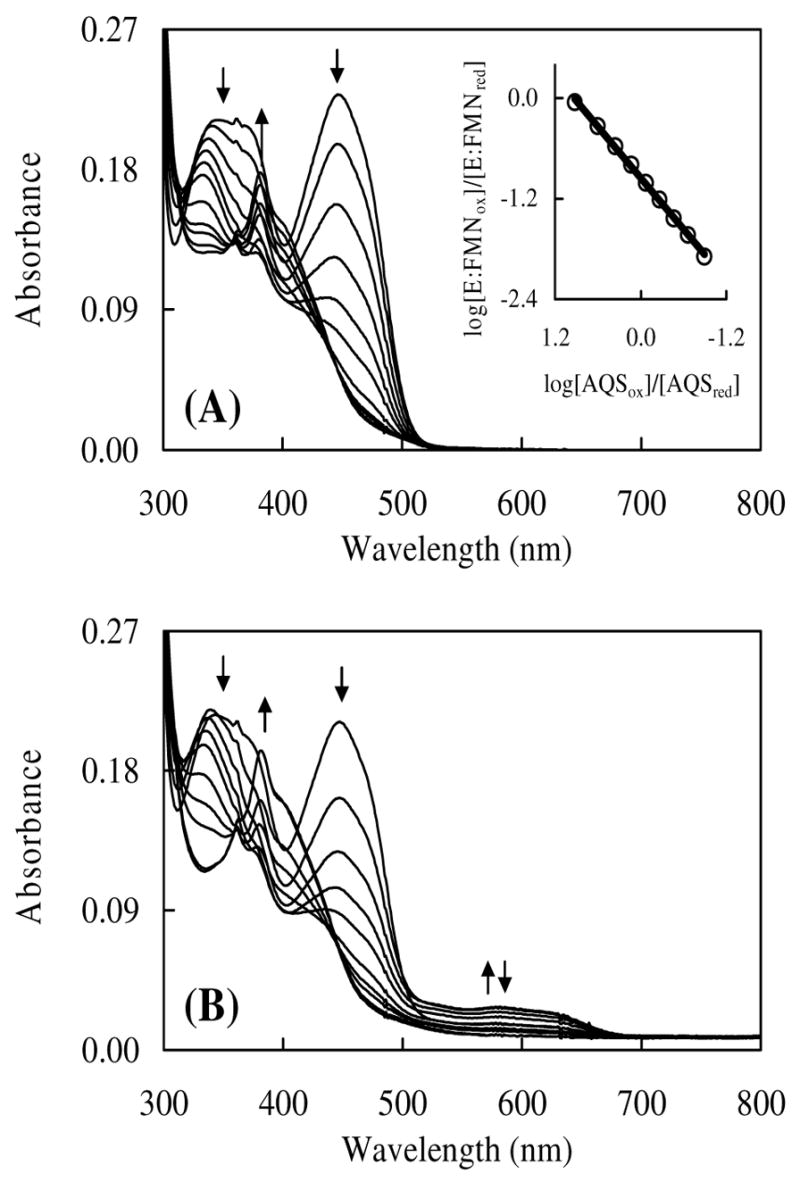
FIGURE 5.

(A) Anaerobic reduction of IDI-2 by the xanthine oxidase reducing system in the absence of IPP. IDI-2 (20 μM) in 0.1 M potassium phosphate buffer (pH 7.0), containing 17 μM FMN, 0.4 mM hypoxanthine, 2 μM methyl viologen, and 18 μM anthroquinone-2-sulfonate (AQS) was incubated under anaerobic conditions at 25 °C with 0.55 mg bovine milk xanthine oxidase (0.084 units/mg). Spectra from top to bottom were recorded at 0, 7.5, 11.5, 15.5, 19.5, 23.5, 31.5, 39.5, 43.5, 51.5 and 59.5 min. Increased absorbance at 381 nm began after 20 min due to the accumulation of reduced AQS. The inset figure shows the Minnaert plot obtained during reduction. Reduction of AQSox was monitored at 332 nm, the isosbestic point for FMNox and FMNred- Reduction of FMN was monitored at 354 nm, the isosbestic point for AQSox and AQSred. (B) Anaerobic reduction of IDI-2 by the xanthine oxidase reducing system in the presence of IPP. Contents and procedures were identical to (A) except for the inclusion of 150μM IPP in the assay. Spectra from top to bottom were recorded at 0.03, 1, 2, 3, 4, 6, 8, 10, 20, and 56 min. The last two spectra are virtually identical. Increased absorbance at 381 nm began after 4 min due to the accumulation of reduced AQS.
