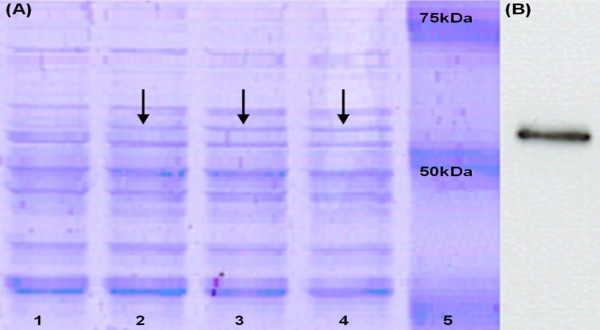
Figure 3.
Optimization of nisin concentration for induction experiments. (A) SDS-PAGE of the induction experiment for 3 h statically at 30°C without nisin addition (lane 1), and using nisin at concentrations of 0.02% (lane 2), 0.1% (lane 3) and 0.2% (lane 4) (v/v). Lane 5 represents the protein marker. (B) Western blot showing LLO at the expected size of about 57 kDa using rabbit anti-LLO as primary antibody.

