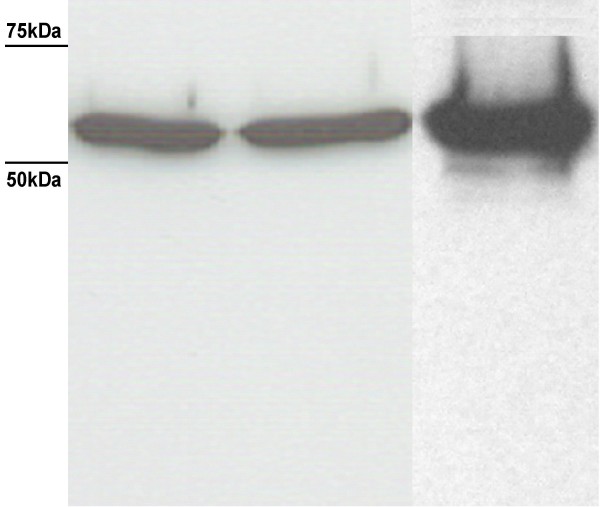
Figure 6.
Western blot showing LLO level and stability after 0.2% nisin induction. Left lane, LLO after 3 h induction (single sonication); Middle lane, LLO after 4 h induction (single sonication); Right lane, LLO after 4 h induction followed by the double sonication treatment (few degradation bands are observed at slightly lower molecular weights).

