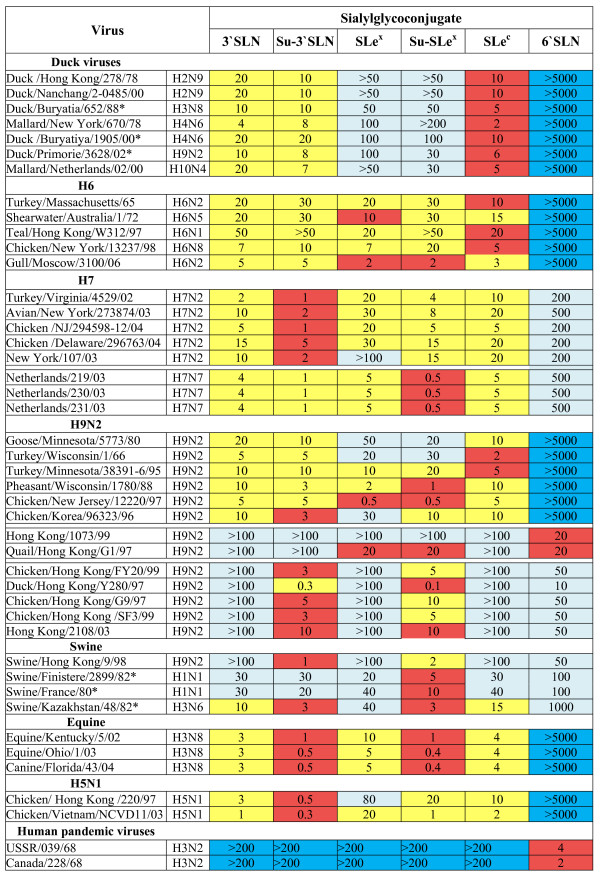
Figure 2.
Binding affinity constants of virus complexes with sialylglycopolymers. The constants were determined as described in the Methods and were expressed in μM of sialic acid. Higher values of constants correspond to lower binding affinities. The data were averaged from 3 sets of experiments. Standard errors did not exceed 50% of the mean values. Viruses labelled with asterisk were kindly provided by Dr. S. Yamnikova, the Ivanovsky Institute of Virology, Moscow, Russia. Colours depict relative levels of binding for each individual virus: red – maximal binding; yellow – good binding; pale cyan – weak binding; blue – no detectable binding.

