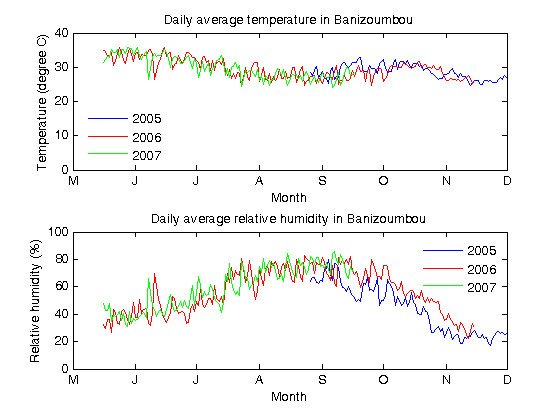
Figure 5.

Temperature and relative humidity in Banizoumbou during rainy seasons of 2005, 2006 and 2007. The figure shows temperature (top panel) and relative humidity (bottom panel) measurements taken at 15-minute intervals for the rainy seasons of 2005, 2006 and 2007. Sampling began in August 2005 and was continuous until mid-November 2006, when a technical fault led to cessation of data collection for that year. Data was received up until mid-September in 2007, after which a technical fault caused observations to be recorded only during daylight hours. Hence daily average values have not been presented after this time. In both panels, 2005 data is in blue, 2006 data is in red and 2007 data is in green.
