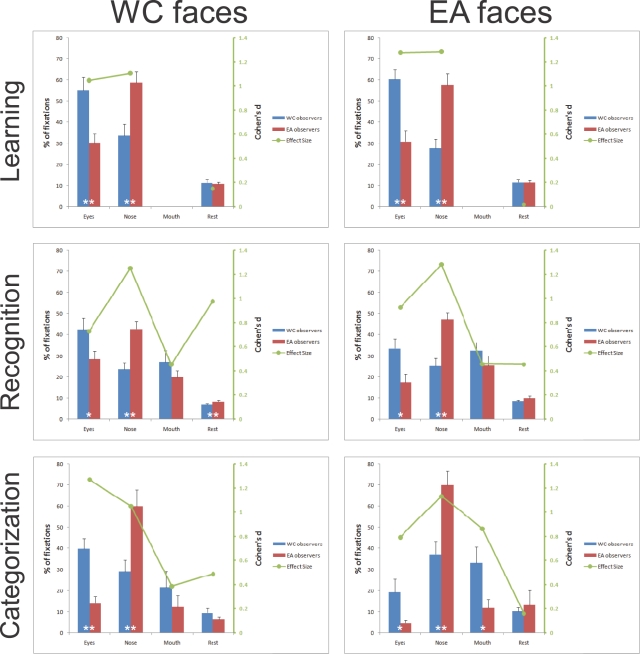
Figure 3. Left y axis: Percentages of fixations landing in the eye, nose, mouth and rest of the facial regions across tasks (WC = Western Caucasian; EA = East Asian).
Error bars report standard errors of the mean. Significant differences between observers from different cultures are reported at the bottom of the bars (* = p<.05; ** = p<.01). Right y axis: Cohen's d (1988) effect size values. Note, that the absence of fixations for the mouth region in the learning condition is due to the lack of significant fixation biases in this region as defined by the fixation map analysis (see the Methods section for details).

