
Figure 2.
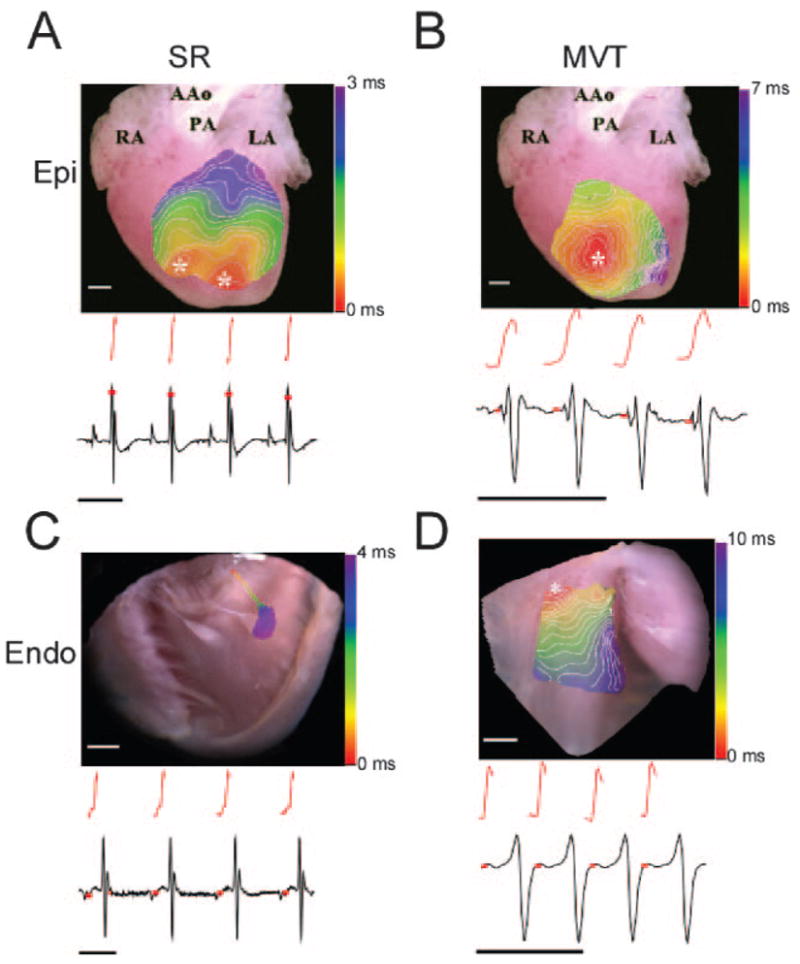
Epicardial (A and B) and endocardial (C and D) activation during SR and MVT in RyR2/RyR2R4496C hearts. A, Epicardial activation map in SR, with corresponding OSPR (red) and ECG. B, Epicardial activation map during MVT, with corresponding OSPR and ECG. C, RV endocardial activation map in SR showing activation sequence in the RBB. OSPR and ECG are shown below. D, RV endocardial activation map during MVT with corresponding OSPR and ECG. White scale bars, 1 mm; black scale bars, 100 ms. Red squares indicate time of OPSR upstroke with respect to ECG; white lines on color maps, 0.5-ms isochrones; Epi, epicardium; Endo, endocardium. See Figure 1, for the remaining abbreviations.