
Figure 4.
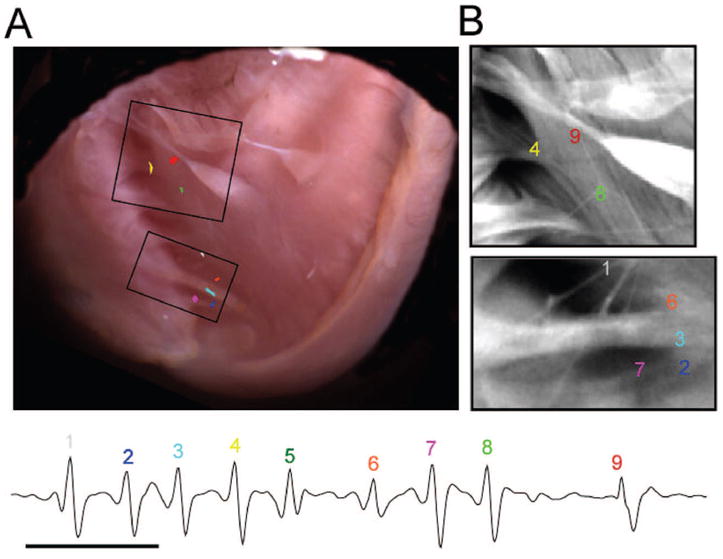
PVT in RyR2/RyR2R4496C heart. A, Location of each of 8 consecutive ectopic discharges during PVT superimposed on a high-resolution image of RV endocardium. Each color corresponds to a different discharge and complex number on ECG. B, Magnification of 2 boxed areas in A highlights Purkinje fibers. Each number and color indicates the origin of each discharge and complex number on ECG. Beat 5 originated outside the field of view and is not represented on the map.