
Figure 2.
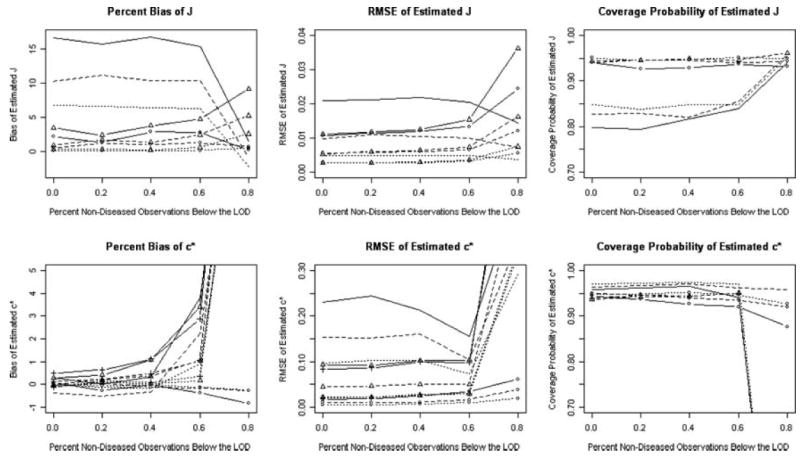
Percent Bias, RMSE and coverage probability of 95% confidence intervals for estimator of J = 0.4 and c* = 2.25 from MLE (circle), GLM (J : triangle; c*: triangle and cross), EMP (smooth) methods as a function of percent below the limit of detection. Graphs display sample sizes of 50 (solid lines), 100 (dashed lines), and 200 (dotted lines).