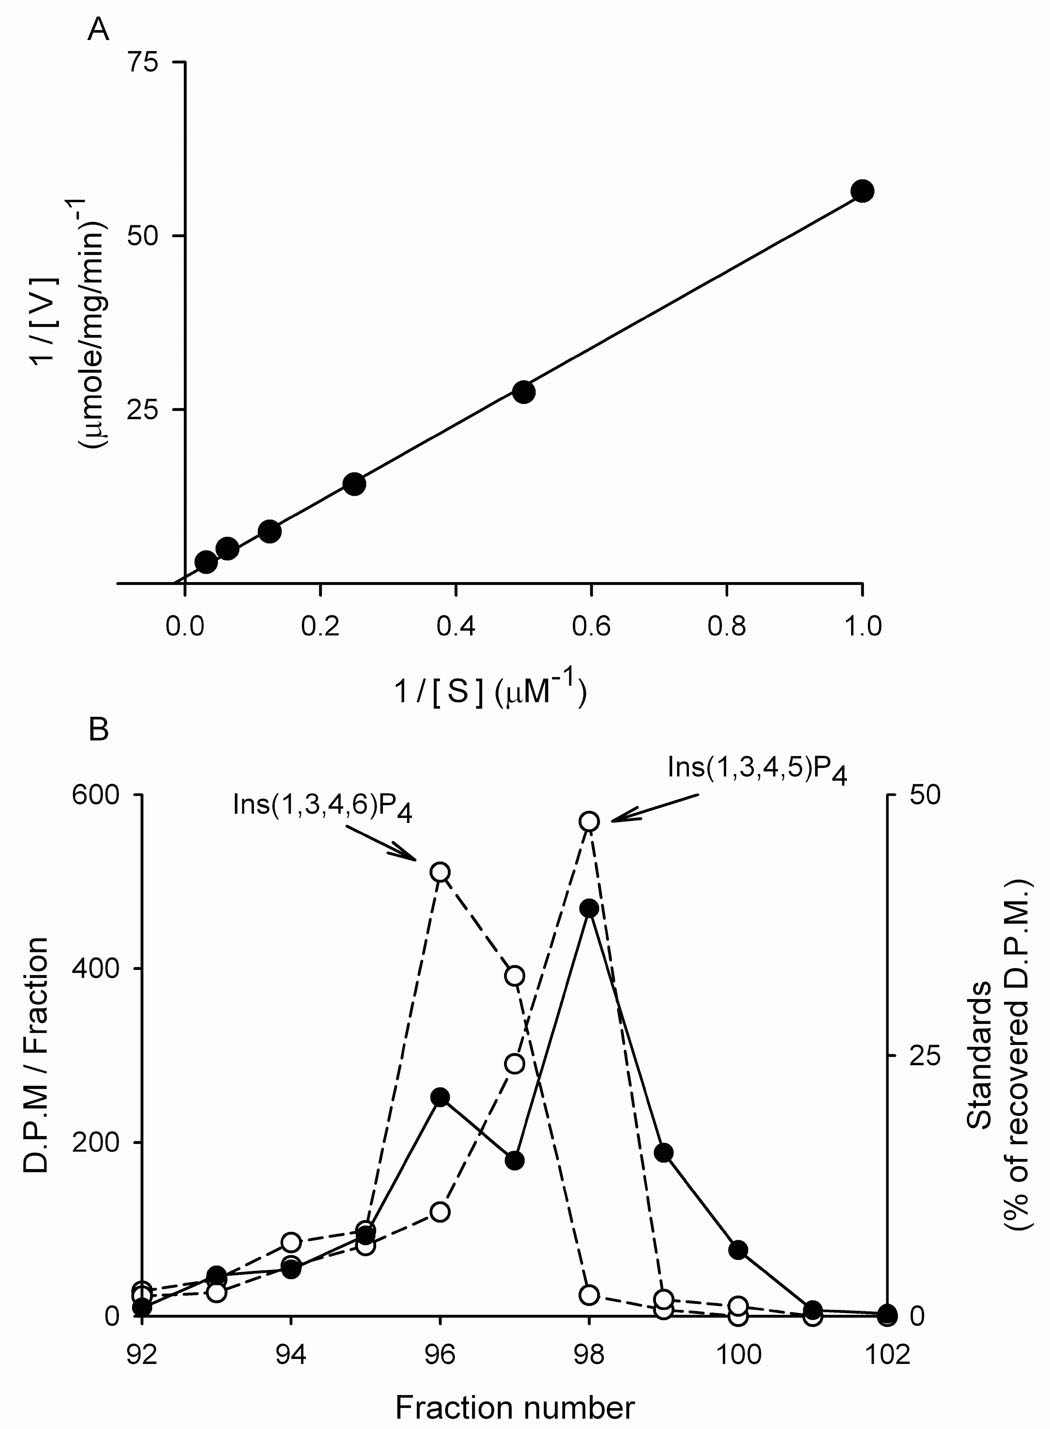
Figure 3. Ins(1,3,4)P3 phosphorylation by soybean Itpk.

Panel A shows a representative kinetic plot for the phosphorylation of [3H]-Ins(1,3,4)P3 by GmItpk3 (see also Table 1). Panel B describes the analysis of the products of [3H]-Ins(1,3,4)P3 phosphorylation by 2 µg GmItpk2 (filled circles) using Q100 HPLC chromatography as described in Methods. The open circles denote the elution of [14C]-labeled standards of Ins(1,3,4,5)P4 (added in the same HPLC run) and Ins(1,3,4,6)P4 (added in a parallel run). Similar data were obtained in two additional experiments.
